
Experiments, causal effects, and risk tradeoffs
Measure whether a control improves outcomes rather than only changing them.
Compare cohorts at equal maturity
Enlarge to read every label and explore the connections
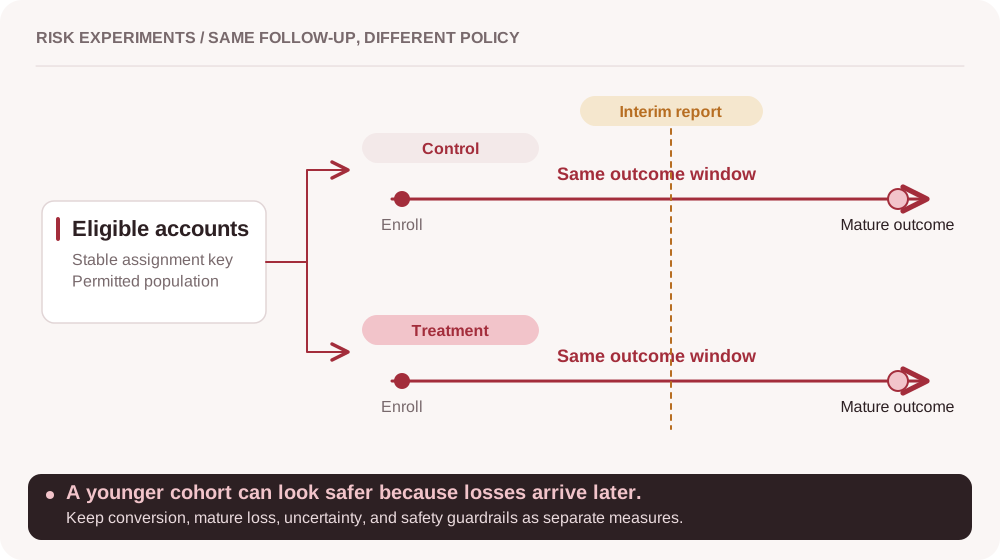
Stable random assignment helps identify an intervention’s effect. Compare risk outcomes after equivalent follow-up.
Define the intervention and assignment unit.
Keep assignment stable through repeat activity.
Compare mature outcomes and show uncertainty.
The new rule launches on Monday. Loss falls on Tuesday. On the same day, the largest risky merchant leaves the platform. The chart shows a change. It does not yet show what caused it.
Define the intervention and estimand
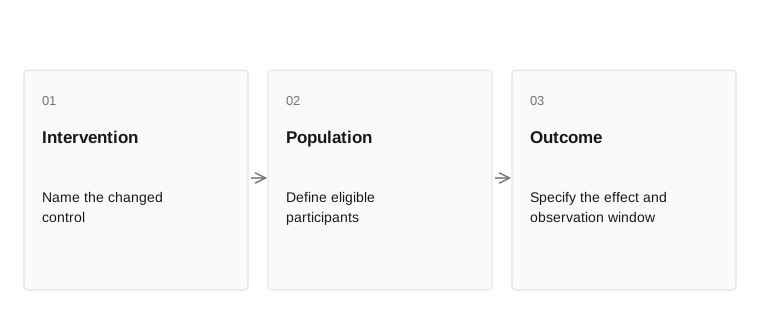
- InterventionName the changed control
- PopulationDefine eligible participants
- OutcomeSpecify the effect and observation window
An experiment needs a specific intervention and a quantity it aims to estimate. For example, compare two permitted authentication flows on completion, confirmed loss, and customer support cost. The estimand states whose outcomes, over what period, under which assignment.
Keep mandatory legal controls outside an experiment that would bypass them. Use an approved test population and guardrails. The goal is to learn within permitted activity. A vague objective such as improve risk cannot specify a sample, a stopping rule, or a useful result.
An intervention is the change applied to the system. An estimand is the particular effect the analysis intends to measure. “Does the new rule help” is incomplete until help has a unit, population, time horizon, and outcome. The effect on all eligible accounts can differ from the effect on accounts that actually received a challenge, because challenge receipt itself depends on the policy and customer behavior.
Write the analysis contract before reading the result. Define assignment, exclusions, outcome maturity, primary measures, and material customer or operational limits. Otherwise, a team can unintentionally select the time window or subgroup that makes a weak result look convincing. A clear contract also makes an inconclusive result useful by showing which uncertainty remains.
Inside the mechanism. An estimand states the population, intervention, comparison, outcome, and period whose effect is being estimated. Assignment to a new policy and receipt of a particular action are different variables. An intention-to-treat analysis follows assignment and can preserve the benefit of randomization; an analysis restricted to those who received an action can reintroduce selection. Define the primary comparison before inspecting outcomes.
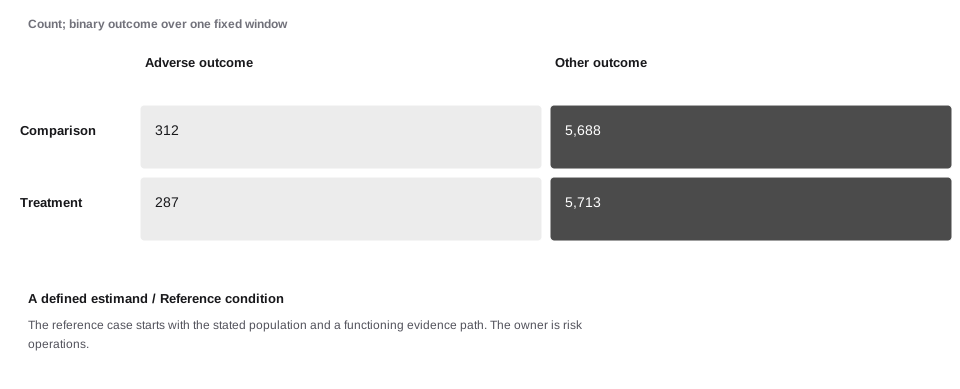
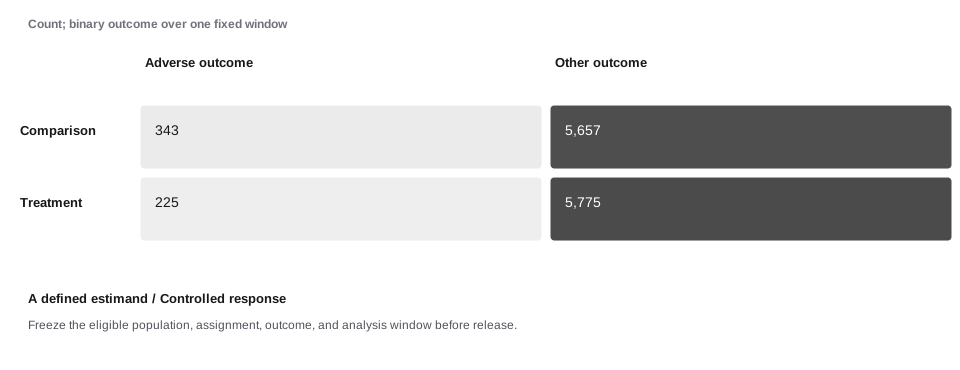
A concrete example. The experiment must state whose outcome changes, over which period, and under which assignment. Approval rate and net mature loss answer different questions. The comparison arm has 312/6000 adverse outcomes (5.20%) and the treatment arm has 287/6000 (4.78%). The absolute difference is -0.42 percentage points, with an illustrative large-sample 95% interval from -1.20 to 0.36. Interpretation depends on assignment integrity, outcome maturity, independence, and the actual decision being evaluated.
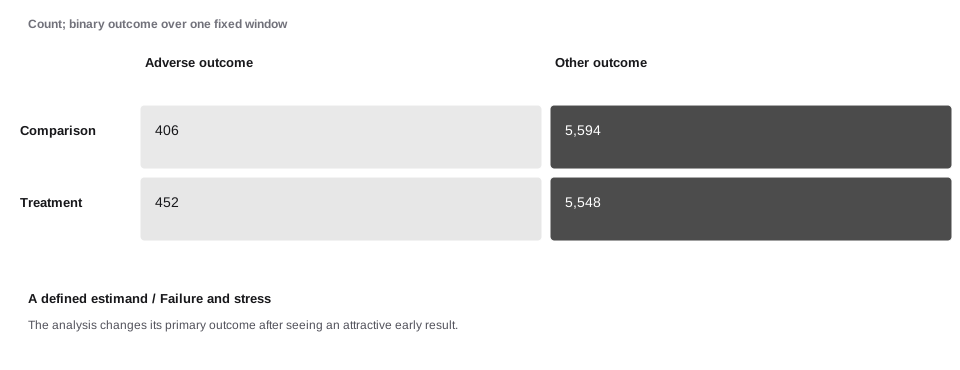
When the assumption fails. The analysis changes its primary outcome after seeing an attractive early result. Freeze the eligible population, assignment, outcome, and analysis window before release. The following worked sequence shows the reference condition, a stress condition, and a response condition with explicit synthetic data. These are comparative assumptions, not measured causal effects.
The experiment must state whose outcome changes, over which period, and under which assignment. Approval rate and net mature loss answer different questions.
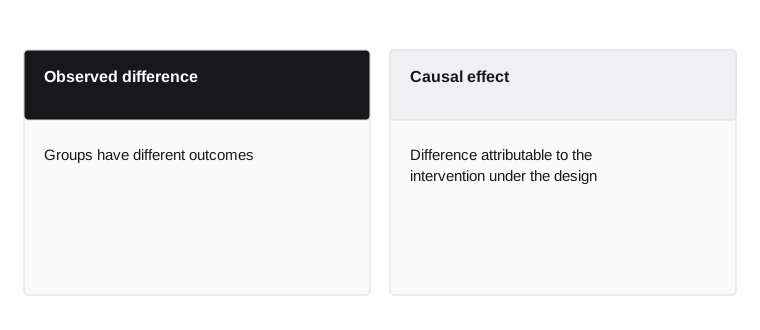
- Observed difference
- Groups have different outcomes
- Causal effect
- Difference attributable to the intervention under the design
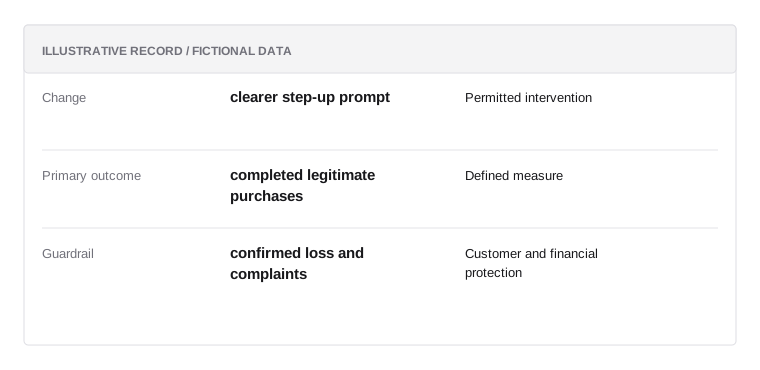
Experiment contract
Illustrative data; not a real customer record or a prescribed policy.
- Changeclearer step-up prompt
Permitted intervention
- Primary outcomecompleted legitimate purchases
Defined measure
- Guardrailconfirmed loss and complaints
Customer and financial protection
The experiment needs a clear success definition
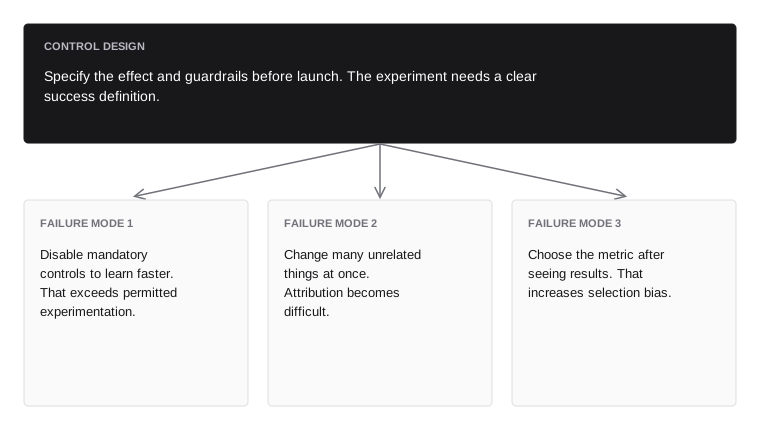
Specify the effect and guardrails before launch. The experiment needs a clear success definition.
- Failure mode 1avoid
- Disable mandatory controls to learn faster. That exceeds permitted experimentation.
- Failure mode 2avoid
- Change many unrelated things at once. Attribution becomes difficult.
- Failure mode 3avoid
- Choose the metric after seeing results. That increases selection bias.
Randomize at the right level
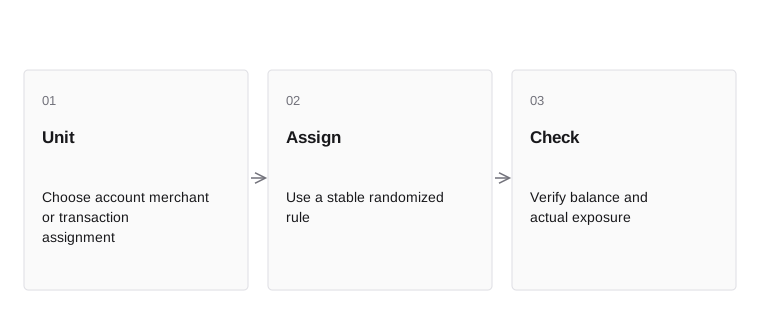
- UnitChoose account merchant or transaction assignment
- AssignUse a stable randomized rule
- CheckVerify balance and actual exposure
Randomization helps balance confounders on average, but the assignment unit matters. If one customer sees both treatments across retries, behavior can spill across groups. Merchant-level interventions may require merchant-level assignment.
Use a stable assignment key and preserve it through the relevant lifecycle. Check sample-ratio mismatch and implementation errors. Randomization does not guarantee balance in every small sample, nor does it solve missing outcomes. Document exclusions and whether they were decided before or after treatment, because post-treatment exclusions can bias the estimate.
Randomization must account for interference. If one customer can make many payments, assigning each payment independently can expose that customer to both policies and change later behavior. Shared merchants, devices, or counterparties can also connect observations. Choose an assignment unit that fits the intervention and use an analysis that respects the resulting dependence. Larger assignment groups may reduce the number of independent observations, which changes uncertainty even when the raw transaction count is large.
Inside the mechanism. Randomization should respect interference and shared state. Transactions within one account can affect a shared limit; related accounts can share devices or reviewers. Cluster assignment may reduce contamination but changes precision and sample-size needs. A simple design-effect illustration uses 1 plus cluster size minus one times within-cluster correlation. That approximation does not replace an analysis suited to the actual assignment and dependence structure.
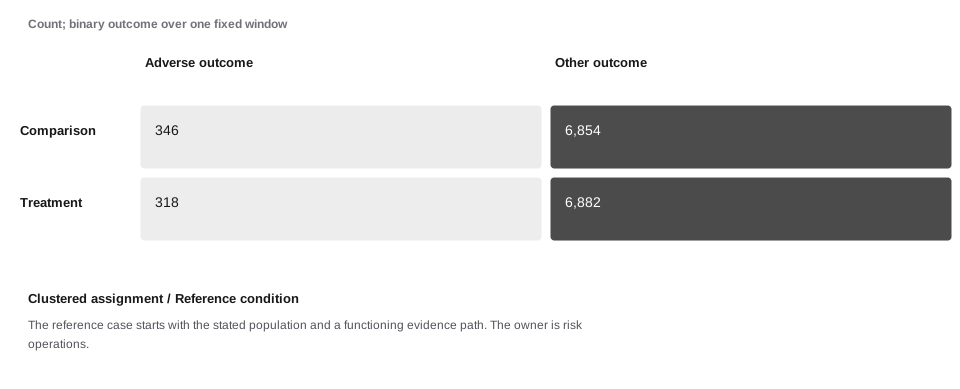
A concrete example. Related transactions can influence each other through shared limits, devices, and review decisions. Row-level assignment may contaminate both treatment groups. The comparison arm has 346/7200 adverse outcomes (4.81%) and the treatment arm has 318/7200 (4.42%). The absolute difference is -0.39 percentage points, with an illustrative large-sample 95% interval from -1.07 to 0.30. Interpretation depends on assignment integrity, outcome maturity, independence, and the actual decision being evaluated.
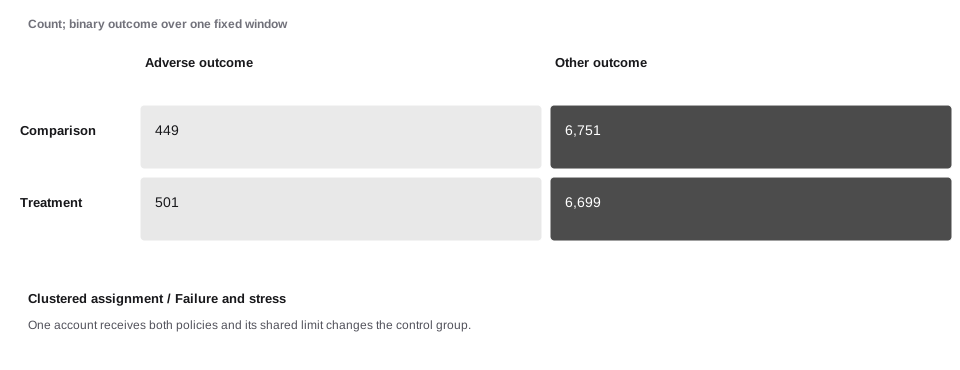
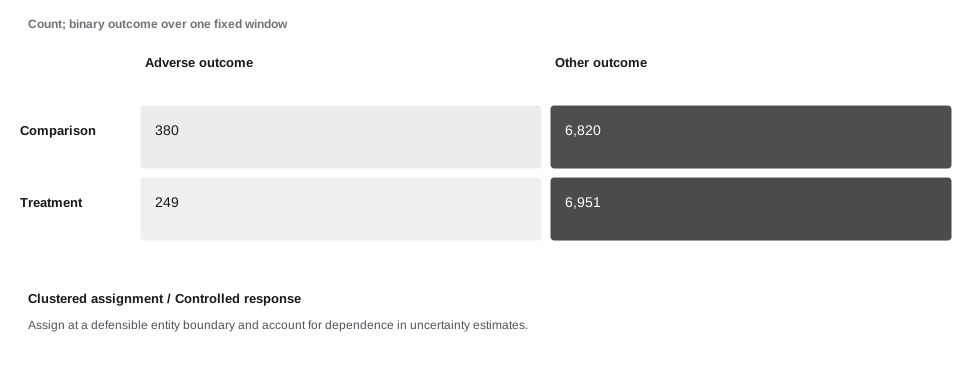
When the assumption fails. One account receives both policies and its shared limit changes the control group. Assign at a defensible entity boundary and account for dependence in uncertainty estimates. The following worked sequence shows the reference condition, a stress condition, and a response condition with explicit synthetic data. These are comparative assumptions, not measured causal effects.
Related transactions can influence each other through shared limits, devices, and review decisions. Row-level assignment may contaminate both treatment groups.
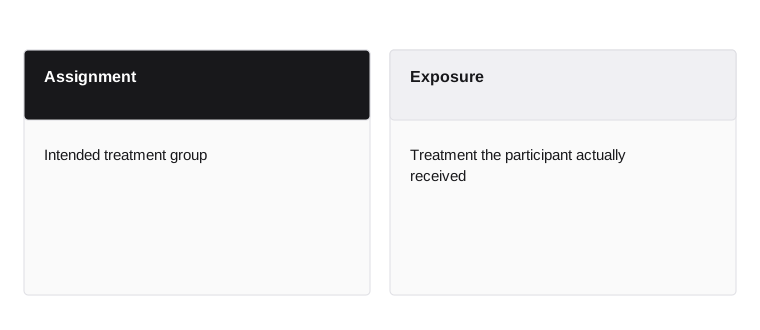
- Assignment
- Intended treatment group
- Exposure
- Treatment the participant actually received
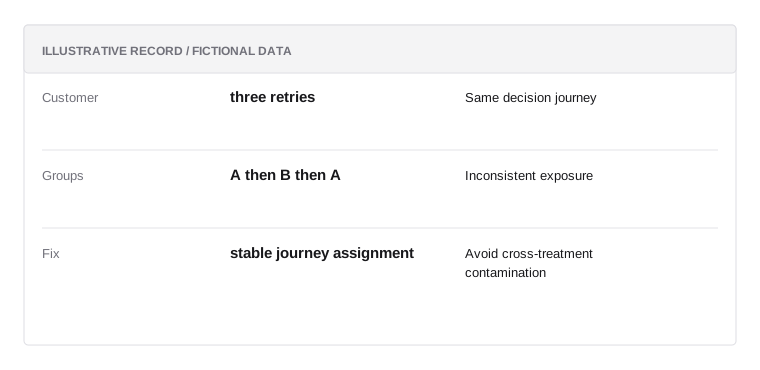
Assignment defect
Illustrative data; not a real customer record or a prescribed policy.
- Customerthree retries
Same decision journey
- GroupsA then B then A
Inconsistent exposure
- Fixstable journey assignment
Avoid cross-treatment contamination
Retries and spillovers can contaminate the comparison
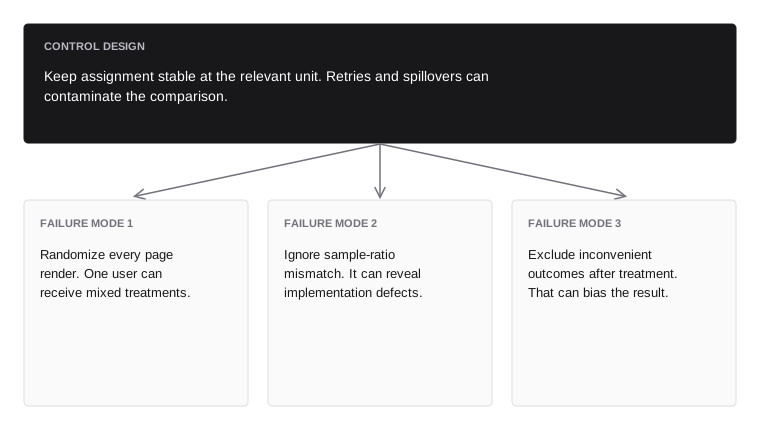
Keep assignment stable at the relevant unit. Retries and spillovers can contaminate the comparison.
- Failure mode 1avoid
- Randomize every page render. One user can receive mixed treatments.
- Failure mode 2avoid
- Ignore sample-ratio mismatch. It can reveal implementation defects.
- Failure mode 3avoid
- Exclude inconvenient outcomes after treatment. That can bias the result.
Wait for mature outcomes
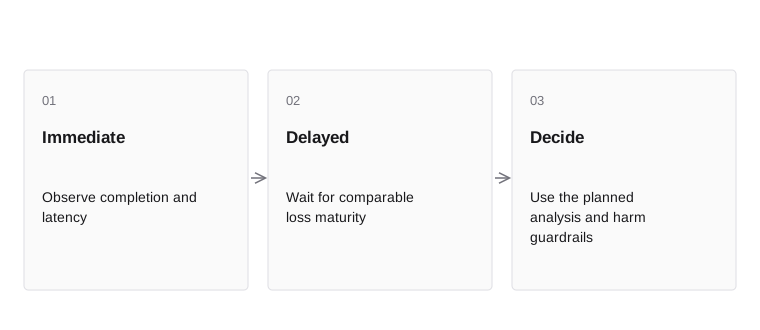
- ImmediateObserve completion and latency
- DelayedWait for comparable loss maturity
- DecideUse the planned analysis and harm guardrails
Risk outcomes often arrive after the customer interaction. Conversion can be measured quickly; disputes, defaults, and recoveries take longer. A test can show a short-term benefit before its loss cost becomes visible.
Define leading and final outcomes with separate reporting. Compare groups at equal maturity and keep uncertainty visible. Avoid stopping as soon as one metric looks favorable. Sequential monitoring requires an appropriate analysis plan if repeated looks influence the decision. The operational team also needs stop conditions for clear harm, independent of the final statistical conclusion.
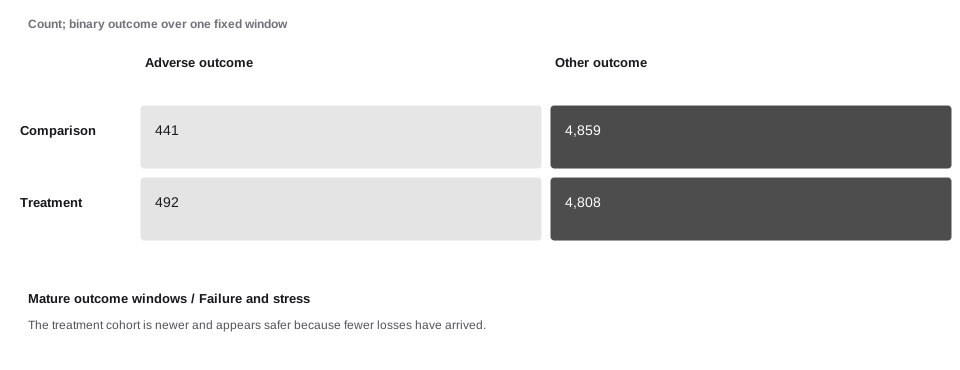
Inside the mechanism. Specify the outcome window and the required follow-up before comparing arms. An equally sized but newer treatment cohort can have fewer observed losses simply because reports are delayed. Track enrollment, exposure, censoring, and label maturity separately. Interim operational signals can support safety monitoring, but they should not be mislabeled as mature financial outcomes.
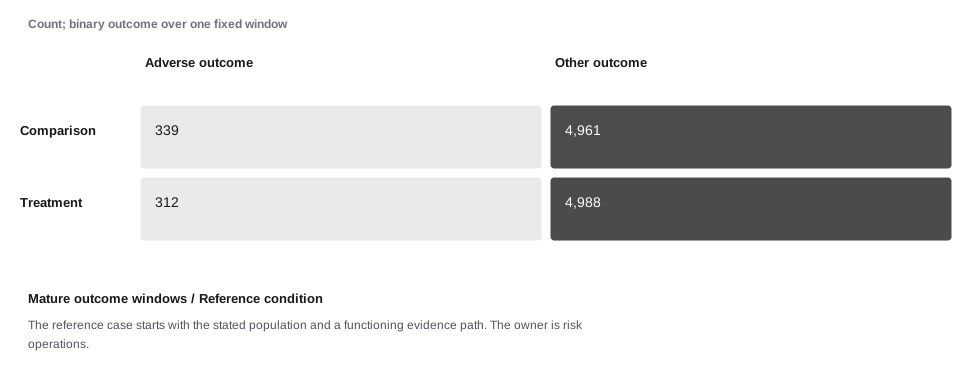
A concrete example. Returns, disputes, and credit losses appear on different schedules. Equal calendar dates do not imply equal time at risk or label maturity. The comparison arm has 339/5300 adverse outcomes (6.40%) and the treatment arm has 312/5300 (5.89%). The absolute difference is -0.51 percentage points, with an illustrative large-sample 95% interval from -1.42 to 0.40. Interpretation depends on assignment integrity, outcome maturity, independence, and the actual decision being evaluated.
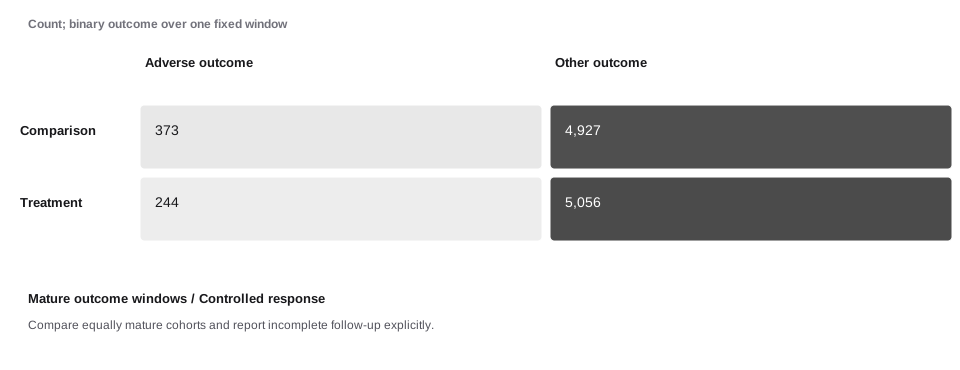
When the assumption fails. The treatment cohort is newer and appears safer because fewer losses have arrived. Compare equally mature cohorts and report incomplete follow-up explicitly. The following worked sequence shows the reference condition, a stress condition, and a response condition with explicit synthetic data. These are comparative assumptions, not measured causal effects.
Returns, disputes, and credit losses appear on different schedules. Equal calendar dates do not imply equal time at risk or label maturity.
- Leading metric
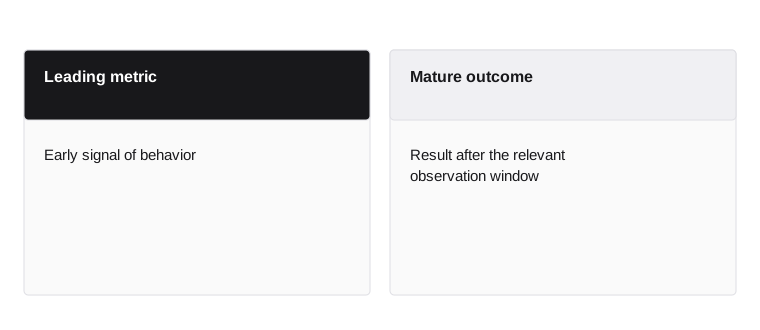
- Early signal of behavior
- Mature outcome
- Result after the relevant observation window
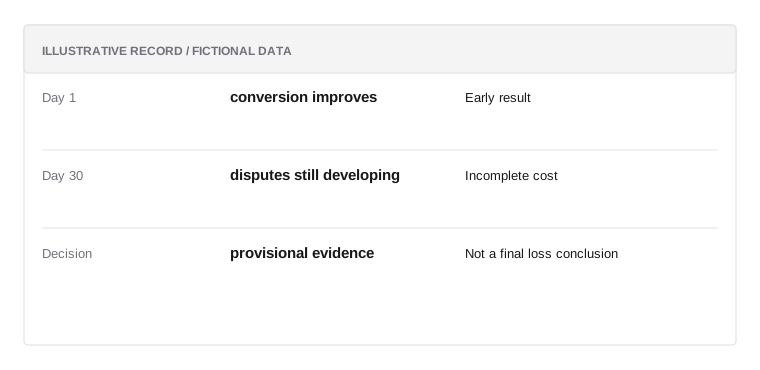
Experiment timeline
Illustrative data; not a real customer record or a prescribed policy.
- Day 1conversion improves
Early result
- Day 30disputes still developing
Incomplete cost
- Decisionprovisional evidence
Not a final loss conclusion
Fast conversion data cannot establish final net benefit
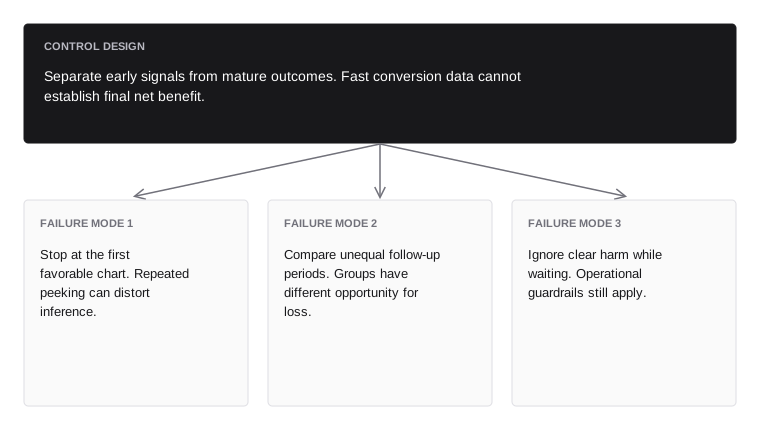
Separate early signals from mature outcomes. Fast conversion data cannot establish final net benefit.
- Failure mode 1avoid
- Stop at the first favorable chart. Repeated peeking can distort inference.
- Failure mode 2avoid
- Compare unequal follow-up periods. Groups have different opportunity for loss.
- Failure mode 3avoid
- Ignore clear harm while waiting. Operational guardrails still apply.
Account for selection and counterfactuals
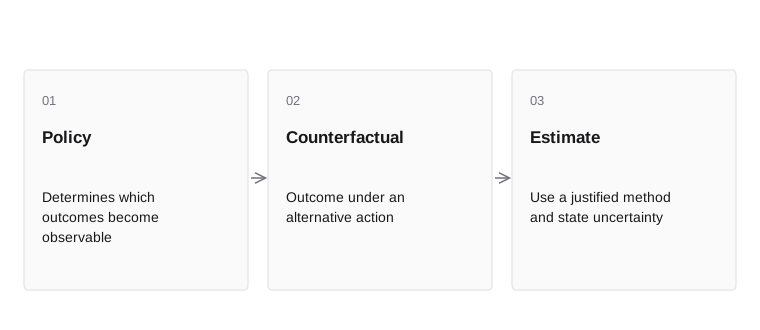
- PolicyDetermines which outcomes become observable
- CounterfactualOutcome under an alternative action
- EstimateUse a justified method and state uncertainty
A declined payment does not reveal whether it would have become fraud if approved. A reviewed customer may behave differently because of the review. Observed labels are shaped by the policy that produced them.
Use randomized evidence where appropriate, carefully designed observational analysis where necessary, and explicit uncertainty where the counterfactual is unavailable. Do not label every decline a prevented loss. In a teaching example, 1,000 declines with a model estimate of 5 percent fraud are not 1,000 confirmed fraud events. Even the 50-event estimate depends on model validity and population assumptions.
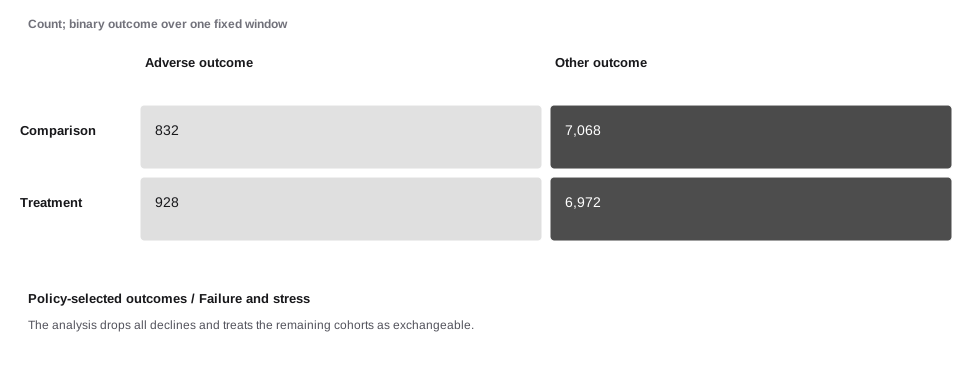
Inside the mechanism. Observed outcomes depend on prior policy. A declined payment does not reveal the loss that would have occurred if approved. Comparing only approvals can change the population in each arm and distort the intended effect. State the missing counterfactual and the assumptions of any correction method. Historical replay can estimate action differences on recorded inputs; it cannot manufacture unobserved customer outcomes.
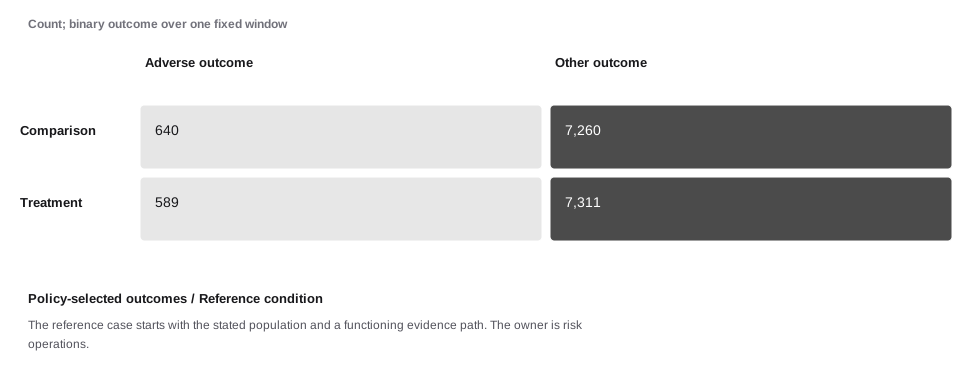
A concrete example. A declined transaction has no observed approved outcome. Comparing only approved transactions can confuse changes in selection with changes in underlying risk. The comparison arm has 640/7900 adverse outcomes (8.10%) and the treatment arm has 589/7900 (7.46%). The absolute difference is -0.65 percentage points, with an illustrative large-sample 95% interval from -1.48 to 0.19. Interpretation depends on assignment integrity, outcome maturity, independence, and the actual decision being evaluated.
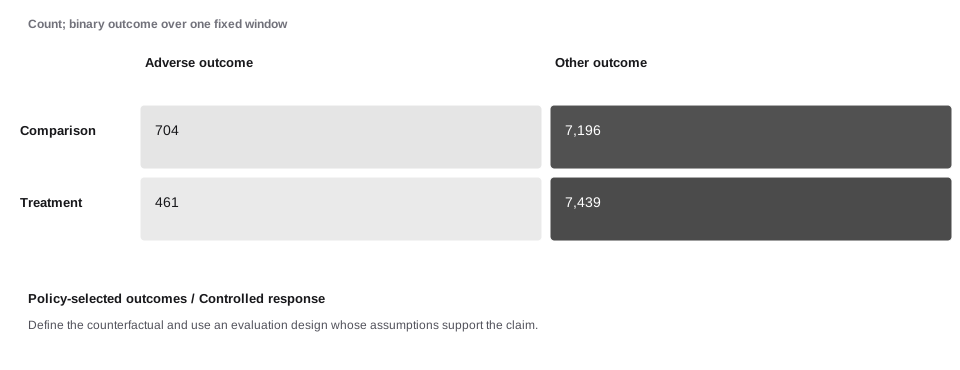
When the assumption fails. The analysis drops all declines and treats the remaining cohorts as exchangeable. Define the counterfactual and use an evaluation design whose assumptions support the claim. The following worked sequence shows the reference condition, a stress condition, and a response condition with explicit synthetic data. These are comparative assumptions, not measured causal effects.
A declined transaction has no observed approved outcome. Comparing only approved transactions can confuse changes in selection with changes in underlying risk.
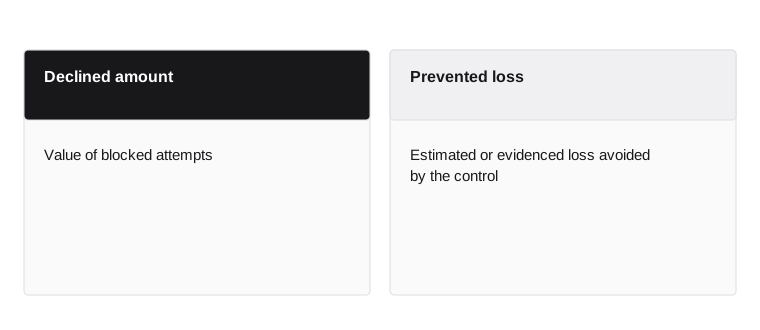
- Declined amount
- Value of blocked attempts
- Prevented loss
- Estimated or evidenced loss avoided by the control
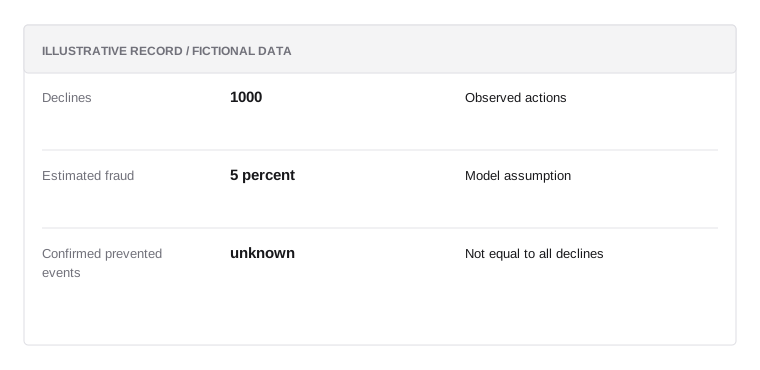
Counterfactual example
Illustrative data; not a real customer record or a prescribed policy.
- Declines1000
Observed actions
- Estimated fraud5 percent
Model assumption
- Confirmed prevented eventsunknown
Not equal to all declines
The rejected outcome is often unobserved
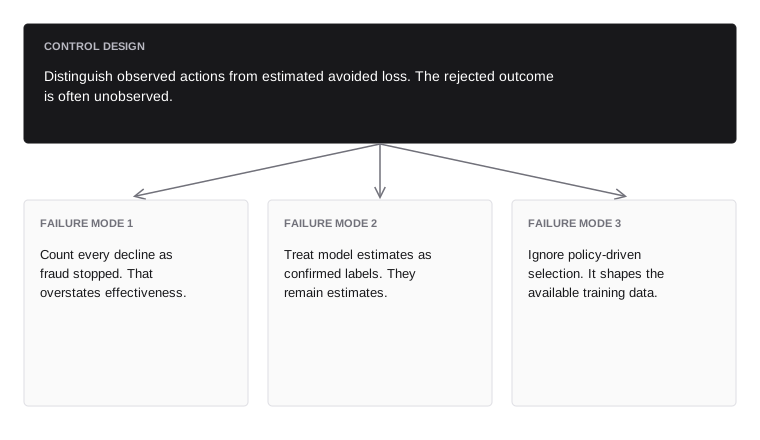
Distinguish observed actions from estimated avoided loss. The rejected outcome is often unobserved.
- Failure mode 1avoid
- Count every decline as fraud stopped. That overstates effectiveness.
- Failure mode 2avoid
- Treat model estimates as confirmed labels. They remain estimates.
- Failure mode 3avoid
- Ignore policy-driven selection. It shapes the available training data.
Report net effect and uncertainty
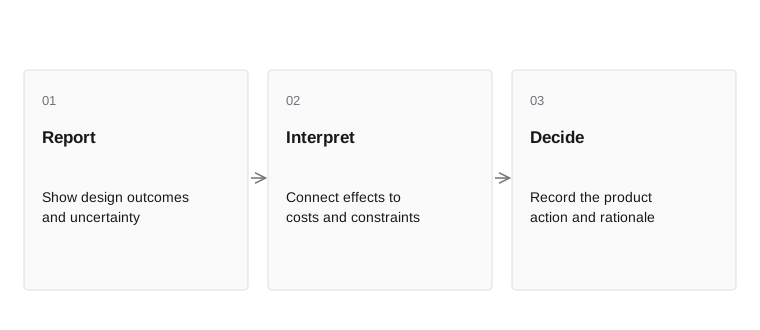
- ReportShow design outcomes and uncertainty
- InterpretConnect effects to costs and constraints
- DecideRecord the product action and rationale
A useful experiment report includes the intervention, population, assignment, sample, duration, outcomes, uncertainty, guardrails, and limitations. Show both the main effect and important segments without turning every noisy subgroup into a firm conclusion.
Translate the result into the product decision. A small approval gain can be valuable if loss and support costs remain acceptable; a large gain may be unacceptable if it creates harm or violates constraints. Keep the decision owner and review date explicit. The report should allow a later reader to understand why the change was adopted or rejected.
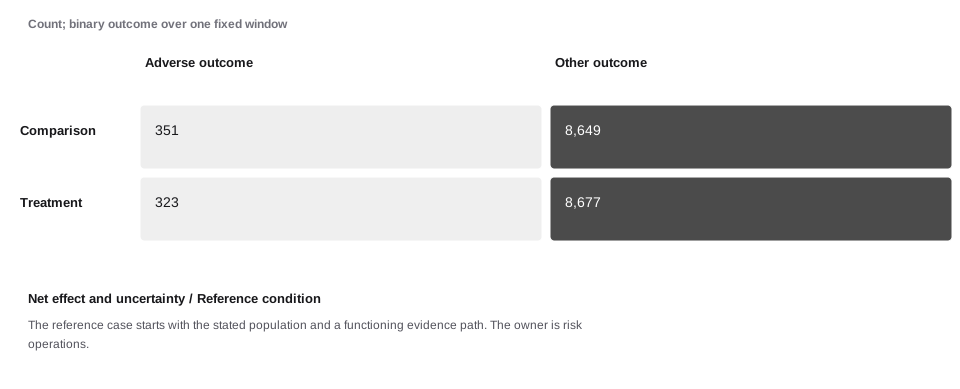
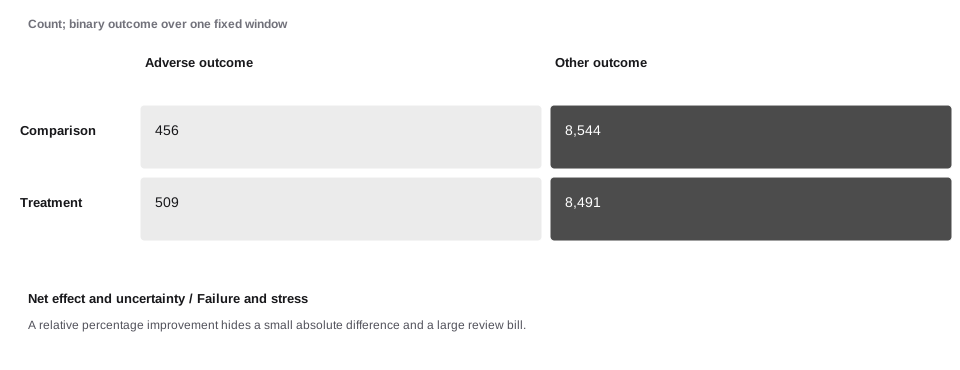
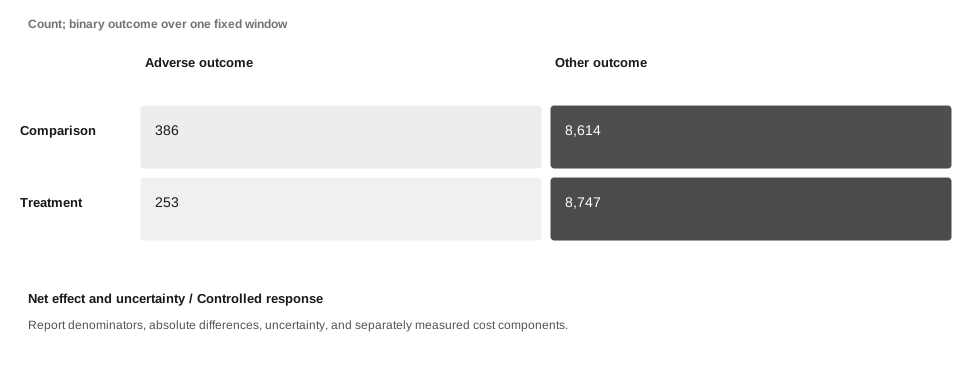
Inside the mechanism. Report absolute changes with denominators and uncertainty, then add separately supported financial and customer effects. A large relative improvement can describe a small absolute change when the baseline is rare. The worked cases show binomial intervals and a simple difference interval under stated assumptions. Clustering, repeated looks, multiple outcomes, and noncompliance can require different methods. A confidence interval is not a guarantee of future performance.
A concrete example. A favorable point estimate can coexist with a wide interval and higher operating cost. Decisions need absolute impact, uncertainty, and material customer effects. The comparison arm has 351/9000 adverse outcomes (3.90%) and the treatment arm has 323/9000 (3.59%). The absolute difference is -0.31 percentage points, with an illustrative large-sample 95% interval from -0.87 to 0.24. Interpretation depends on assignment integrity, outcome maturity, independence, and the actual decision being evaluated.
When the assumption fails. A relative percentage improvement hides a small absolute difference and a large review bill. Report denominators, absolute differences, uncertainty, and separately measured cost components. The following worked sequence shows the reference condition, a stress condition, and a response condition with explicit synthetic data. These are comparative assumptions, not measured causal effects.
A favorable point estimate can coexist with a wide interval and higher operating cost. Decisions need absolute impact, uncertainty, and material customer effects.
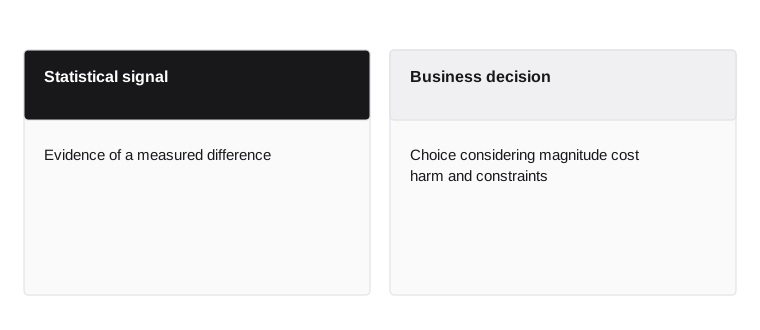
- Statistical signal
- Evidence of a measured difference
- Business decision
- Choice considering magnitude cost harm and constraints
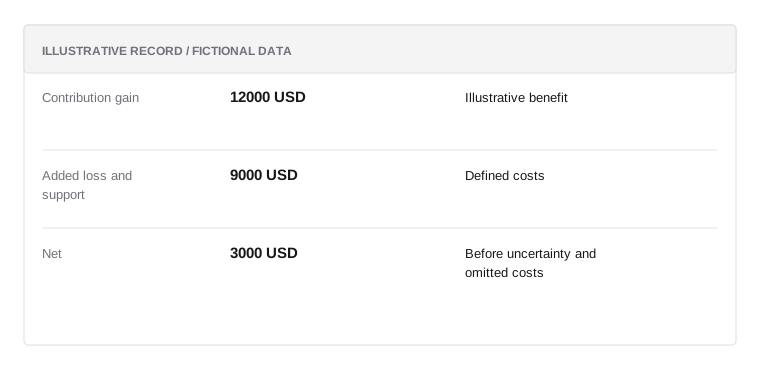
Net-effect example
Illustrative data; not a real customer record or a prescribed policy.
- Contribution gain12000 USD
Illustrative benefit
- Added loss and support9000 USD
Defined costs
- Net3000 USD
Before uncertainty and omitted costs
A significant result is not automatically a good decision
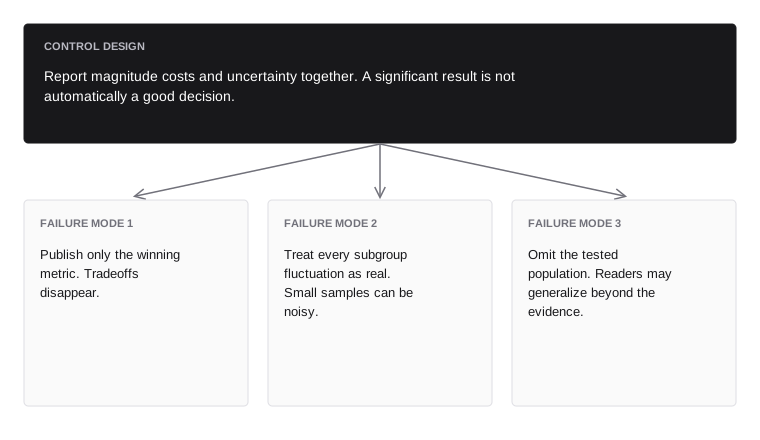
Report magnitude costs and uncertainty together. A significant result is not automatically a good decision.
- Failure mode 1avoid
- Publish only the winning metric. Tradeoffs disappear.
- Failure mode 2avoid
- Treat every subgroup fluctuation as real. Small samples can be noisy.
- Failure mode 3avoid
- Omit the tested population. Readers may generalize beyond the evidence.
Chapter connections
This chapter builds on Risk models, calibration, and delayed outcomes. Continue with Model governance and AI-assisted risk work to follow the next part of the system. Use the glossary for terminology and risk mathematics for formulas and worked calculations.