
Transaction risk and decision economics
Use signals, uncertainty, and cost to choose proportionate actions.
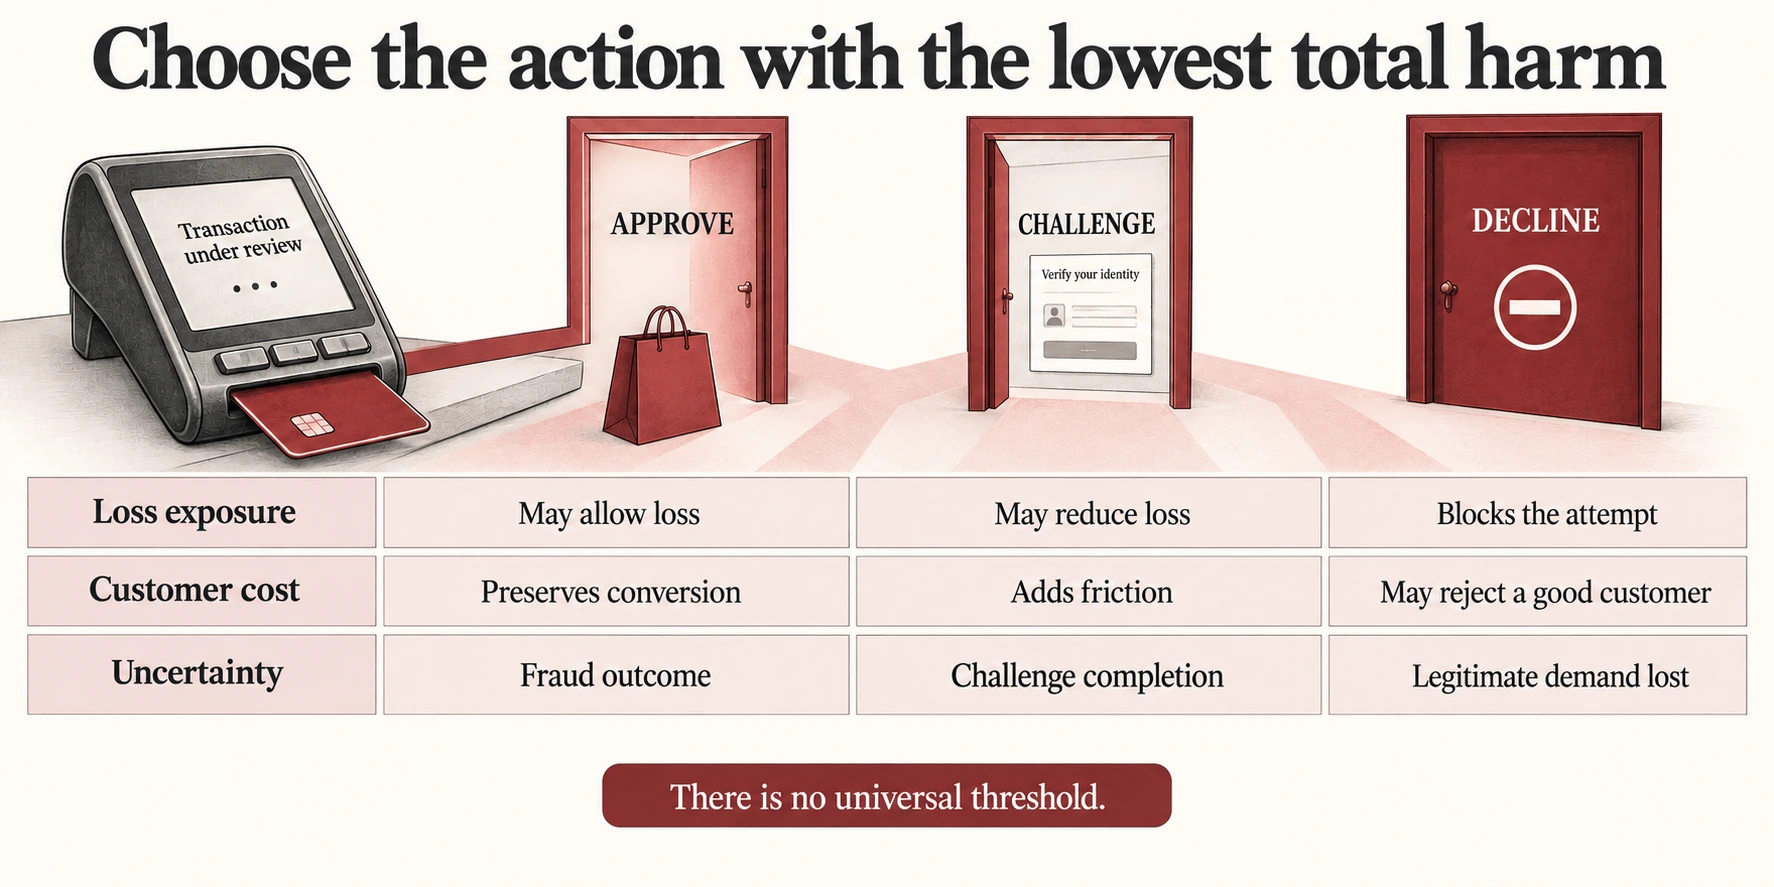
Choose the action with the lowest total harm
Enlarge to read every label and explore the connections
Risk scores are inputs to decisions. Compare fraud loss, customer friction, operating cost, and remaining uncertainty for each action.
Read down one action to see its tradeoffs.
Compare the same cost across all actions.
Use the action that fits the evidence and the context.
A rule blocks every large purchase. Fraud falls. So does the business. The interesting engineering problem is to protect good payments while finding harmful ones, with imperfect evidence and a clock that keeps moving.
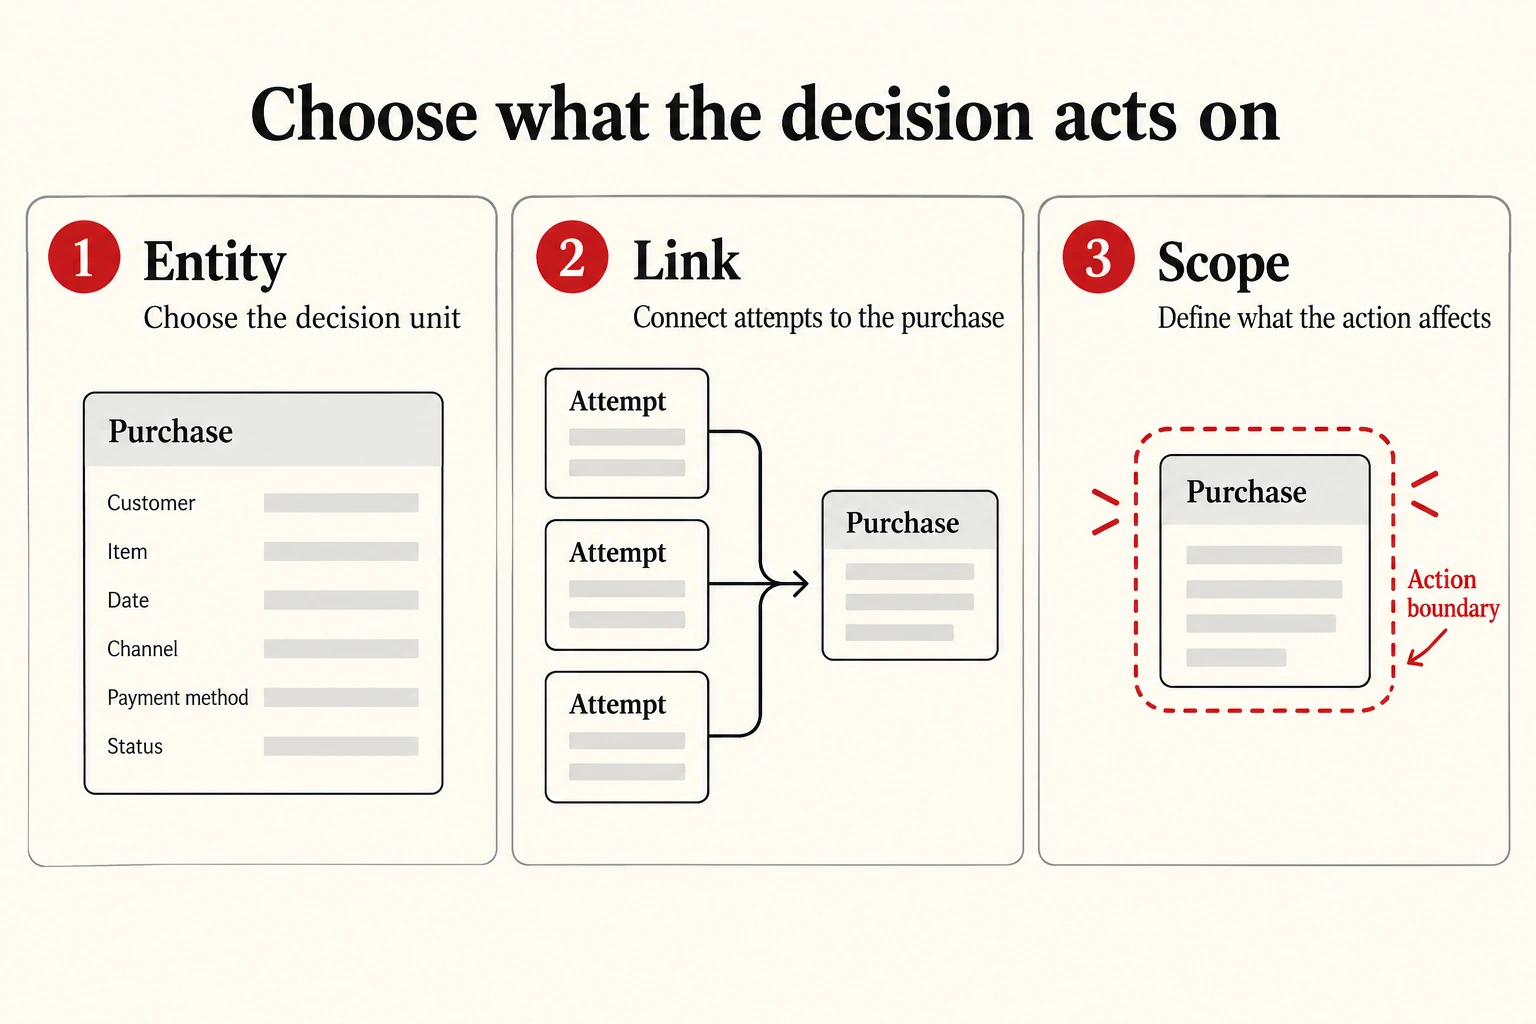
Define the unit of decision
Enlarge to read every label and explore the connections
Diagram text
- Entity. Choose the decision unit
- Link. Connect attempts to the purchase
- Scope. Define what the action affects
A payment attempt, an order, a customer, and a merchant are different units. One order may generate several attempts. A customer-level restriction can affect many orders. Choose the unit before creating labels or measuring approval.
Give each decision a stable identifier and link it to the relevant entities. Separate raw attempt counts from unique purchase counts. Otherwise, repeated retries can make approval appear worse and make a busy customer appear like many unrelated people. The action should also have a scope: blocking one payment is different from closing an account.
Inside the mechanism. Choose whether the decision applies to an attempt, purchase, account, merchant, or transfer instruction. Retries and split operations can otherwise inflate both features and evaluation denominators. Link transport attempts to a stable business action, and state how repeated actions contribute to velocity. The same event stream can answer different questions, but a model trained on attempts should not be reported as though every row were an independent customer purchase.
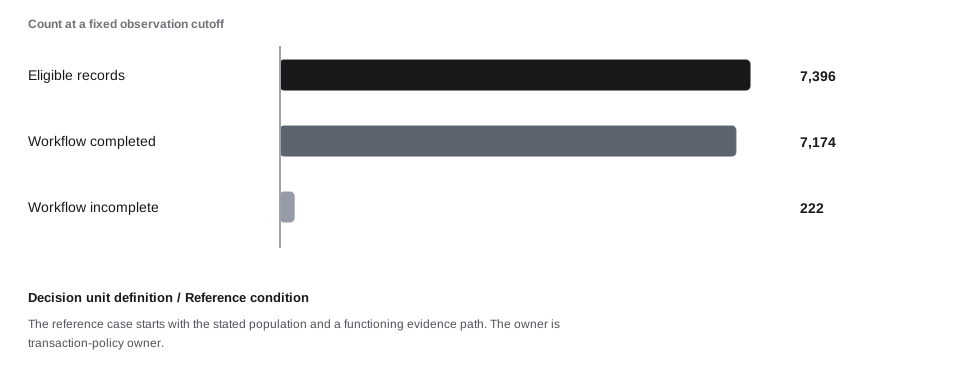
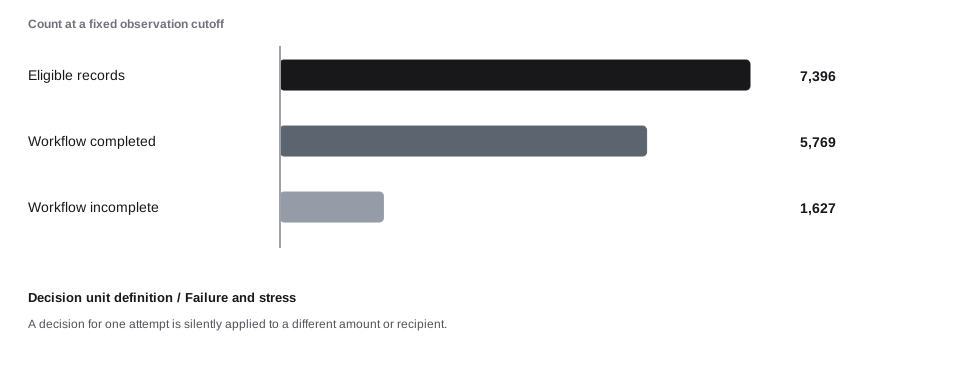
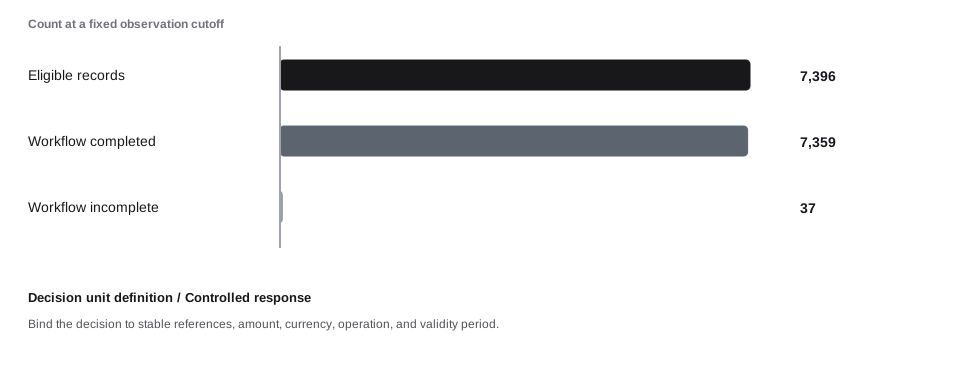
A concrete example. A marketplace order can contain multiple payment attempts and several fulfillments. The risk decision must identify the operation it permits or restricts. The case identifies 7,396 eligible records from a source population of 8,600. The required workflow completes for 7,174, but 108 completed records miss the illustrative internal target. Another 222 remain incomplete. Communication evidence covers 7,102 generated notices. Scope, completion, timeliness, and delivery are four separate properties of the customer outcome.
When the assumption fails. A decision for one attempt is silently applied to a different amount or recipient. Bind the decision to stable references, amount, currency, operation, and validity period. The following worked sequence shows the reference condition, a stress condition, and a response condition with explicit synthetic data. These are comparative assumptions, not measured causal effects.
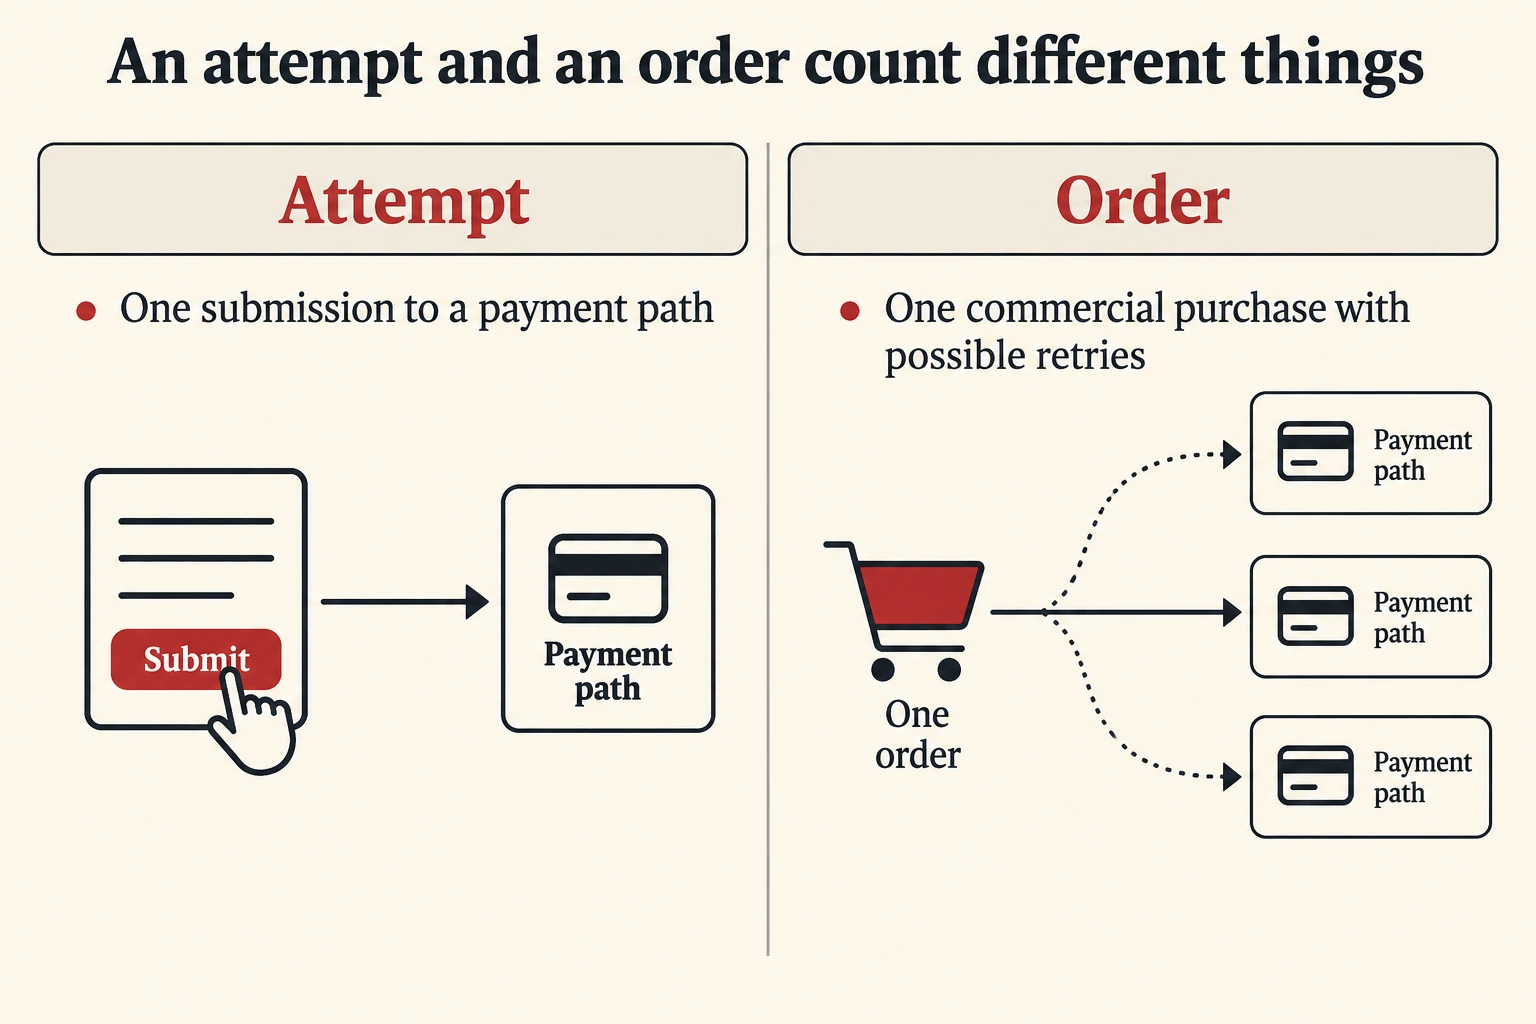
A marketplace order can contain multiple payment attempts and several fulfillments. The risk decision must identify the operation it permits or restricts.
Enlarge to read every label and explore the connections
Diagram text
- Attempt
- One submission to a payment path
- Order
- One commercial purchase with possible retries
Enlarge to read every label and explore the connections
Diagram text
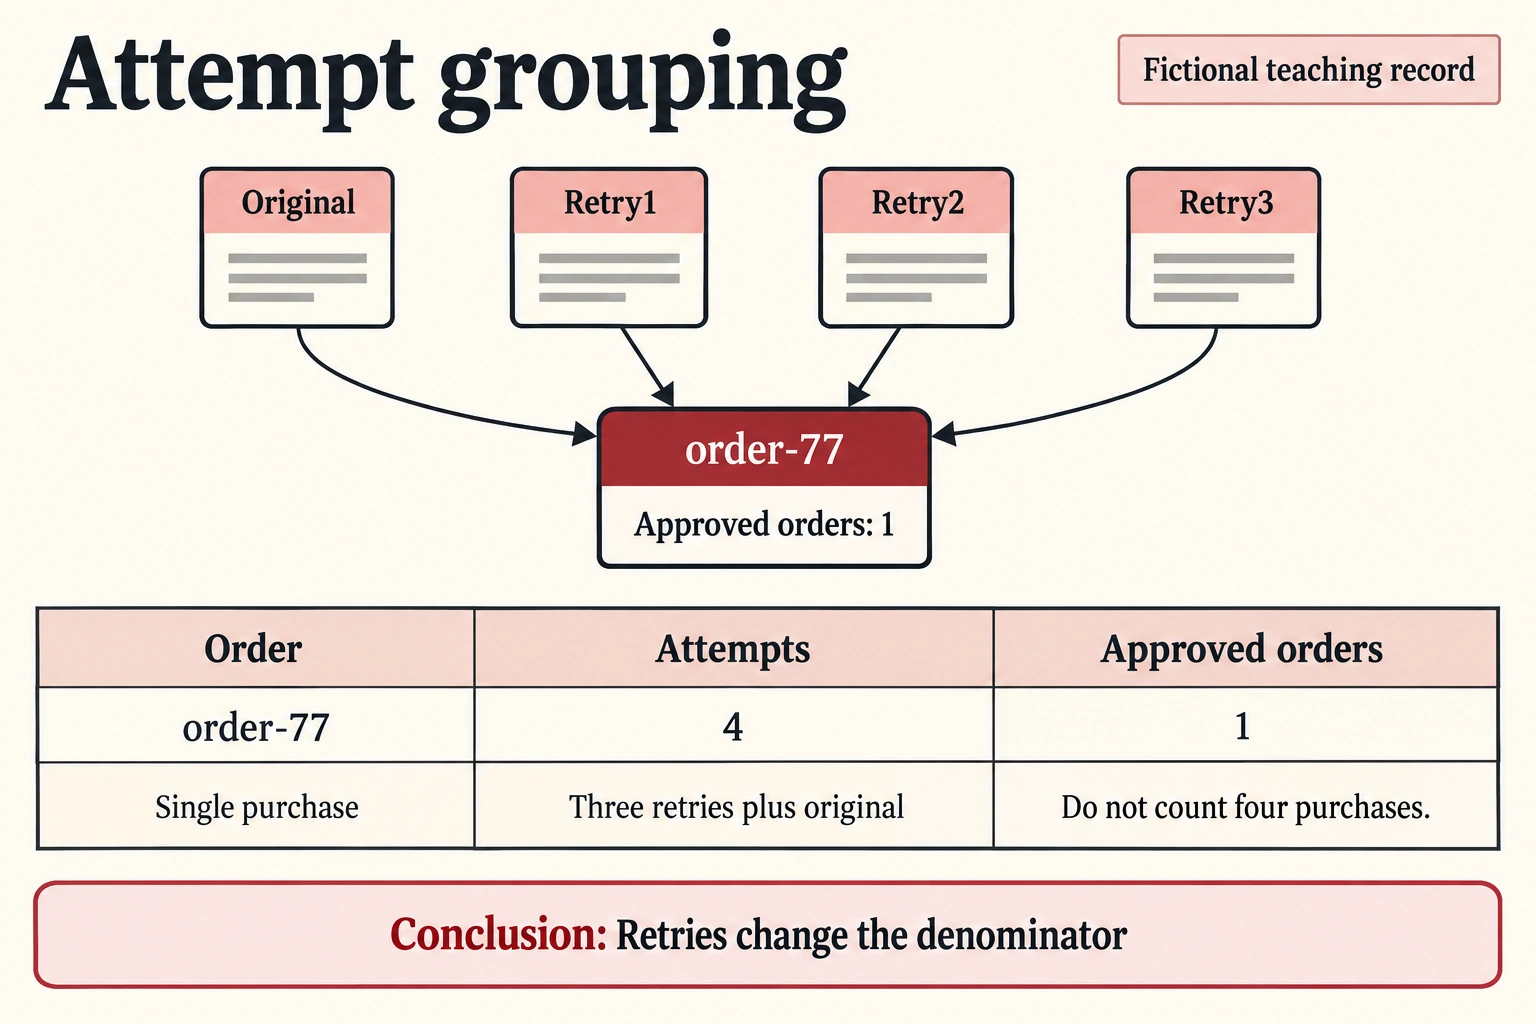
Illustrative data; not a real customer record or a prescribed policy.
- Order: order-77
- Single purchase
- Attempts: 4
- Three retries plus original
- Approved orders: 1
- Do not count four purchases
Retries change the denominator
Enlarge to read every label and explore the connections
Diagram text
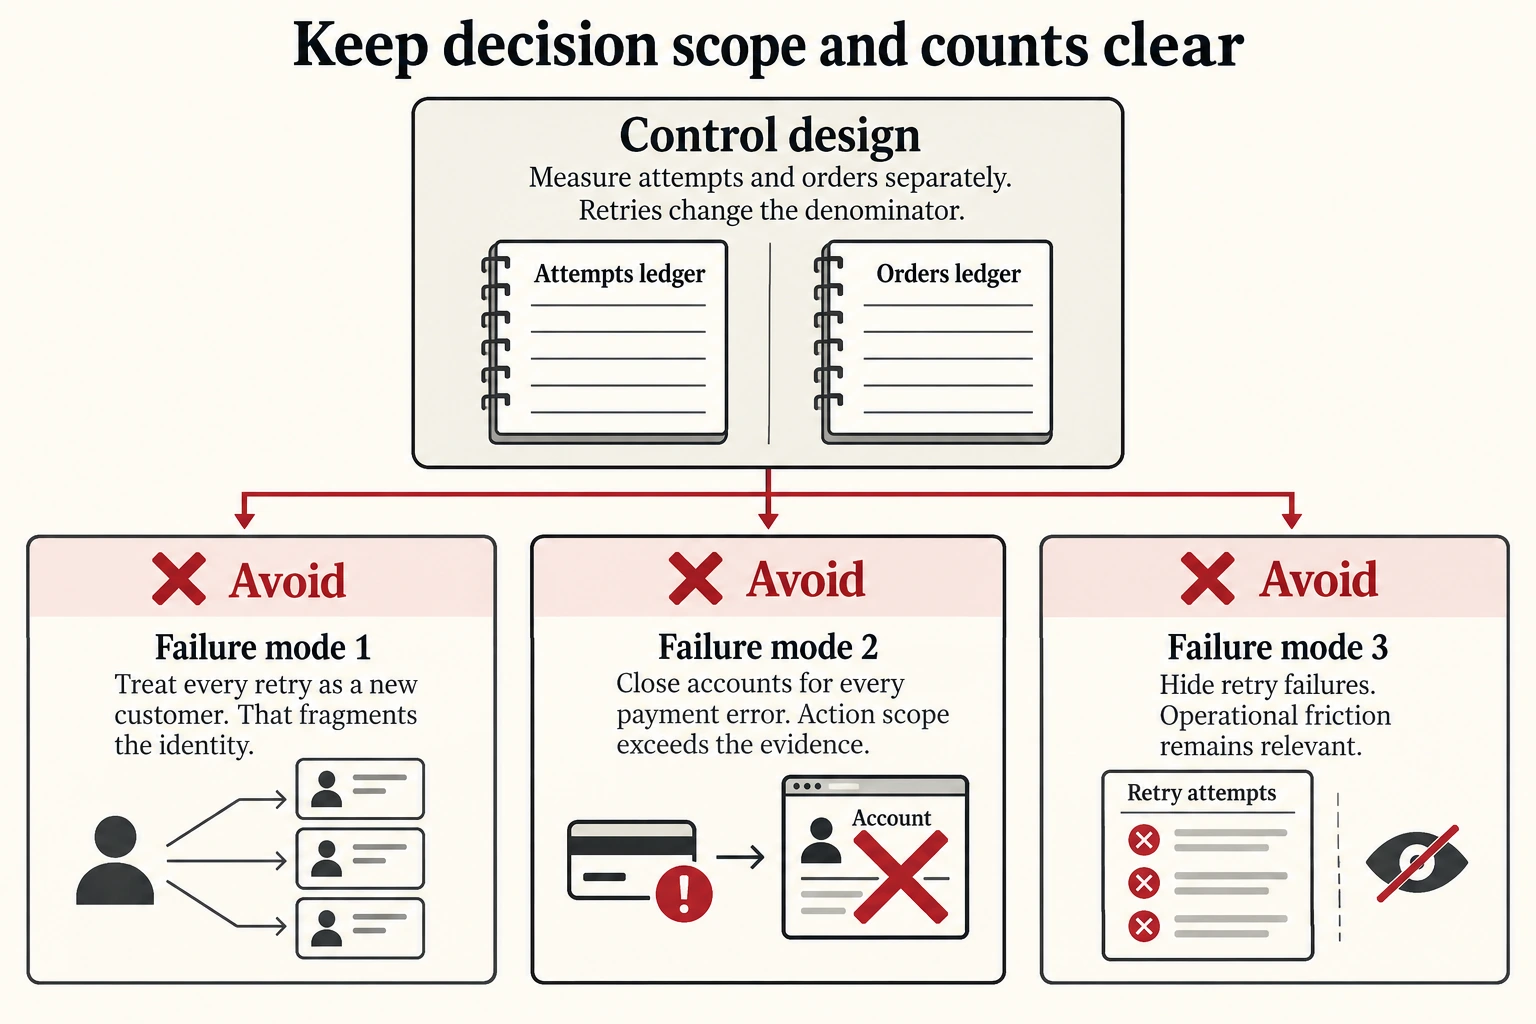
Control design. Measure attempts and orders separately. Retries change the denominator.
- Failure mode 1 — avoid
- Treat every retry as a new customer. That fragments the identity.
- Failure mode 2 — avoid
- Close accounts for every payment error. Action scope exceeds the evidence.
- Failure mode 3 — avoid
- Hide retry failures. Operational friction remains relevant.
Use signals with known meaning
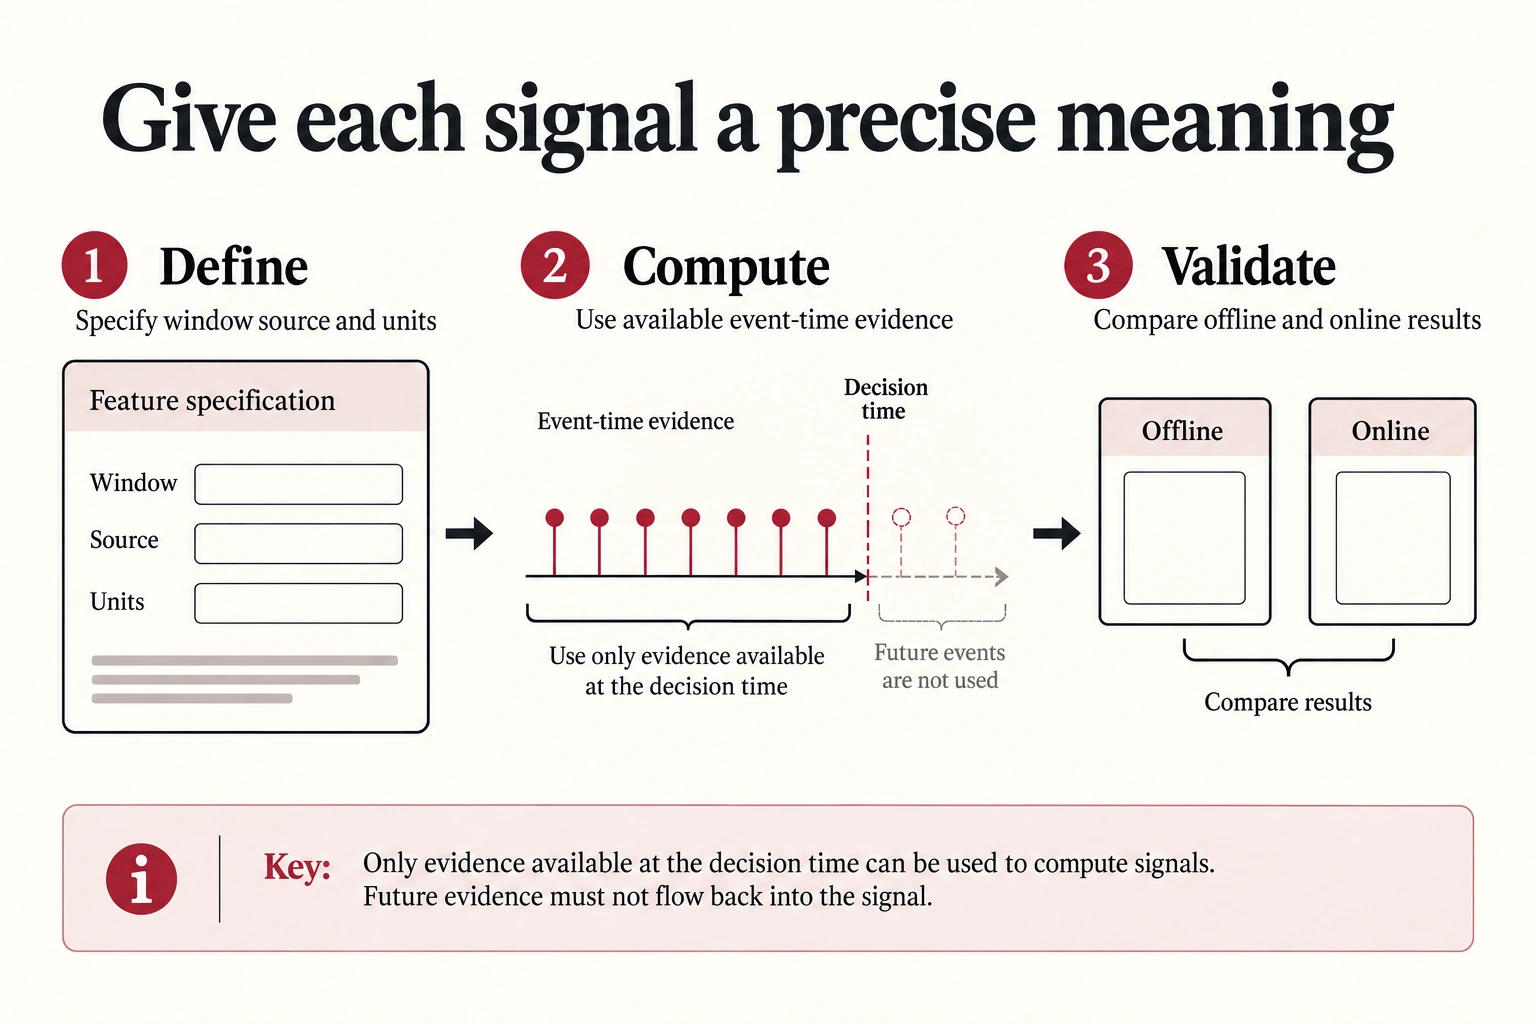
Enlarge to read every label and explore the connections
Diagram text
- Define. Specify window source and units
- Compute. Use available event-time evidence
- Validate. Compare offline and online results
A risk signal is evidence, not a verdict. Device history, amount change, destination novelty, and prior outcomes can all help. Their value depends on data quality, freshness, population, and the event being assessed. A missing value should remain distinguishable from a known safe value.
Write a feature definition with its event window, source, units, and availability time. For example, successful payments in the previous hour excludes the current attempt and must be computed from events available then. Test boundary times and delayed events. A model cannot repair a feature that means different things in training and production.
Inside the mechanism. A feature contract should state its entity, window, unit, source, availability time, and missing-data behavior. Five transfers in ten minutes means little without direction, destination, and the definition of a transfer. A value computed after the action must not enter the historical decision snapshot. Preserve unknown separately from zero. Feature documentation should explain the mechanism it may indicate and the legitimate behavior that can create the same observation.
A concrete example. A model consumes device, behavior, and transaction evidence from several producers. A syntactically valid value can still mean the wrong thing. The rule flags 629 of 19,500 scored payment attempts. Of those flags, 343 meet the synthetic target, giving 54.53% precision. It misses 86 target events. Under the stated cost assumptions, residual loss and operating friction total $30,606. The important result is the connection between the population, action, capacity, and outcome—not one isolated score.
When the assumption fails. Missing device history is coerced into a measured zero. Preserve missingness and versioned feature definitions, then evaluate the action-level impact. The following worked sequence shows the reference condition, a stress condition, and a response condition with explicit synthetic data. These are comparative assumptions, not measured causal effects.
A model consumes device, behavior, and transaction evidence from several producers. A syntactically valid value can still mean the wrong thing.
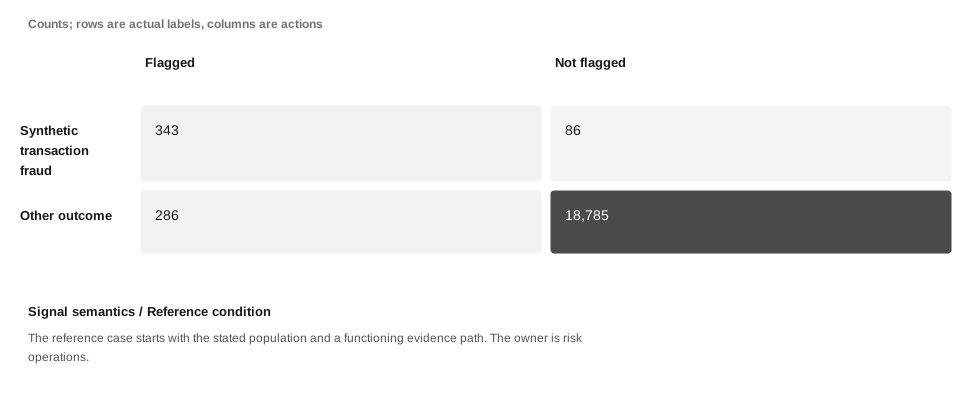
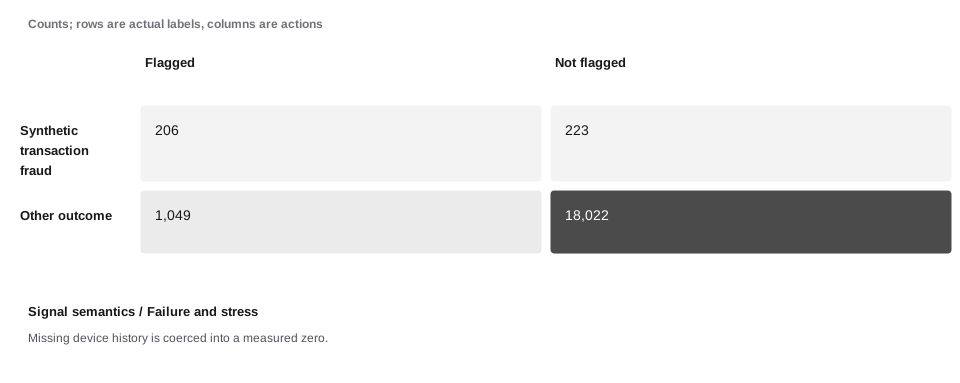
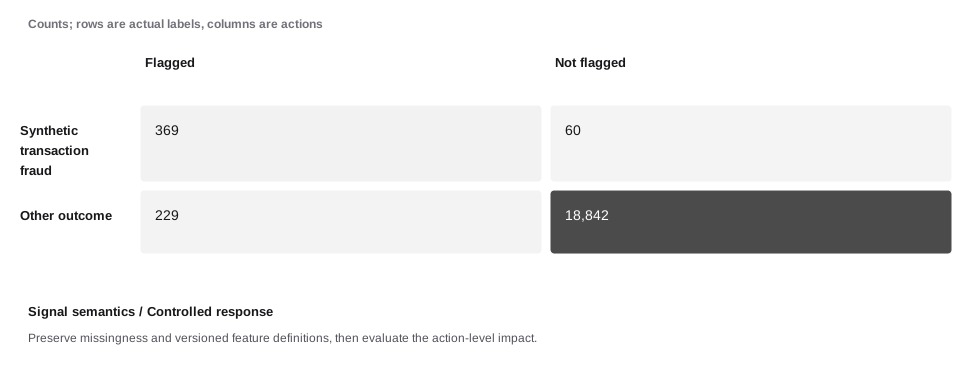
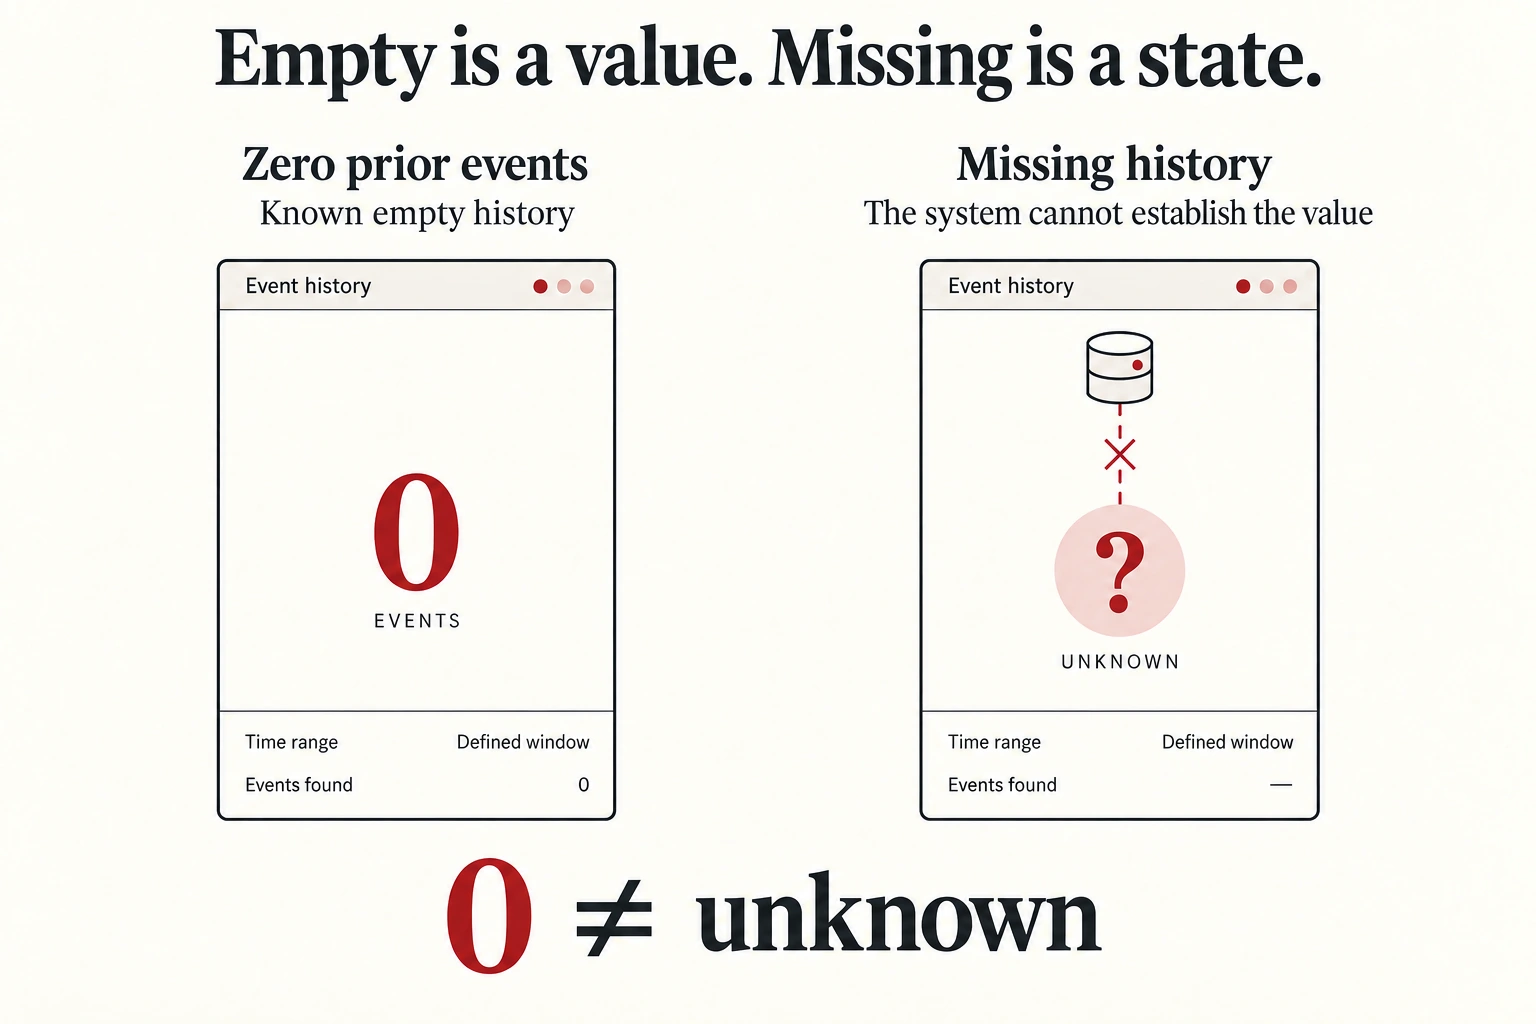
Enlarge to read every label and explore the connections
Diagram text
- Zero prior events
- Known empty history
- Missing history
- The system cannot establish the value
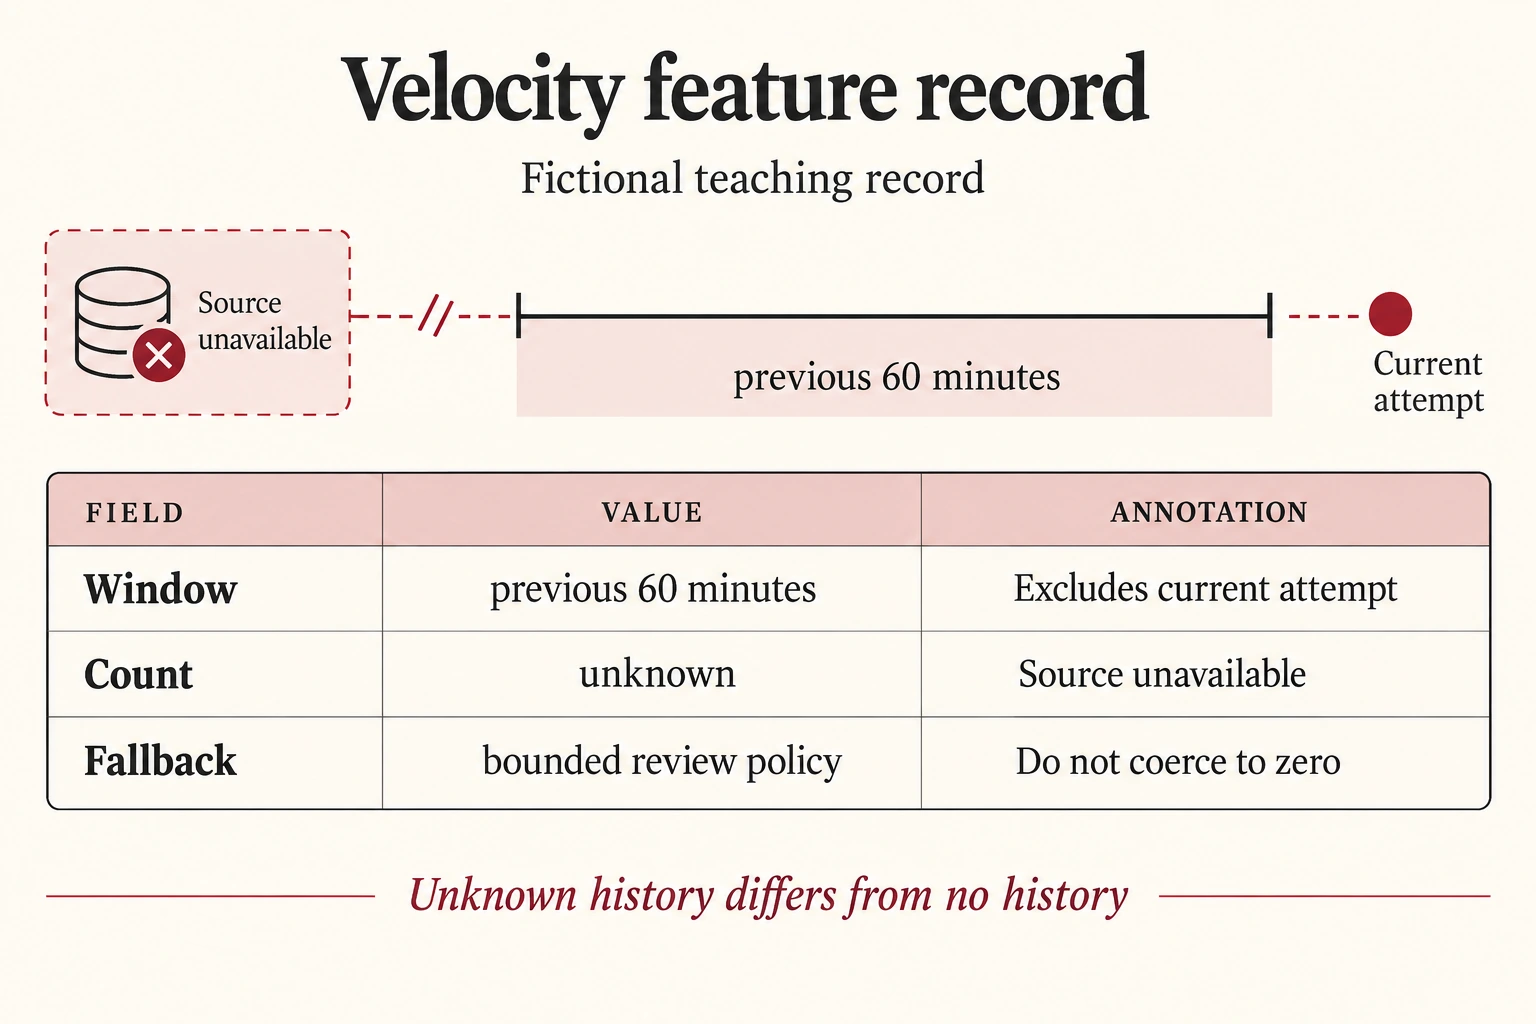
Enlarge to read every label and explore the connections
Diagram text
Illustrative data; not a real customer record or a prescribed policy.
- Window: previous 60 minutes
- Excludes current attempt
- Count: unknown
- Source unavailable
- Fallback: bounded review policy
- Do not coerce to zero
Unknown history differs from no history
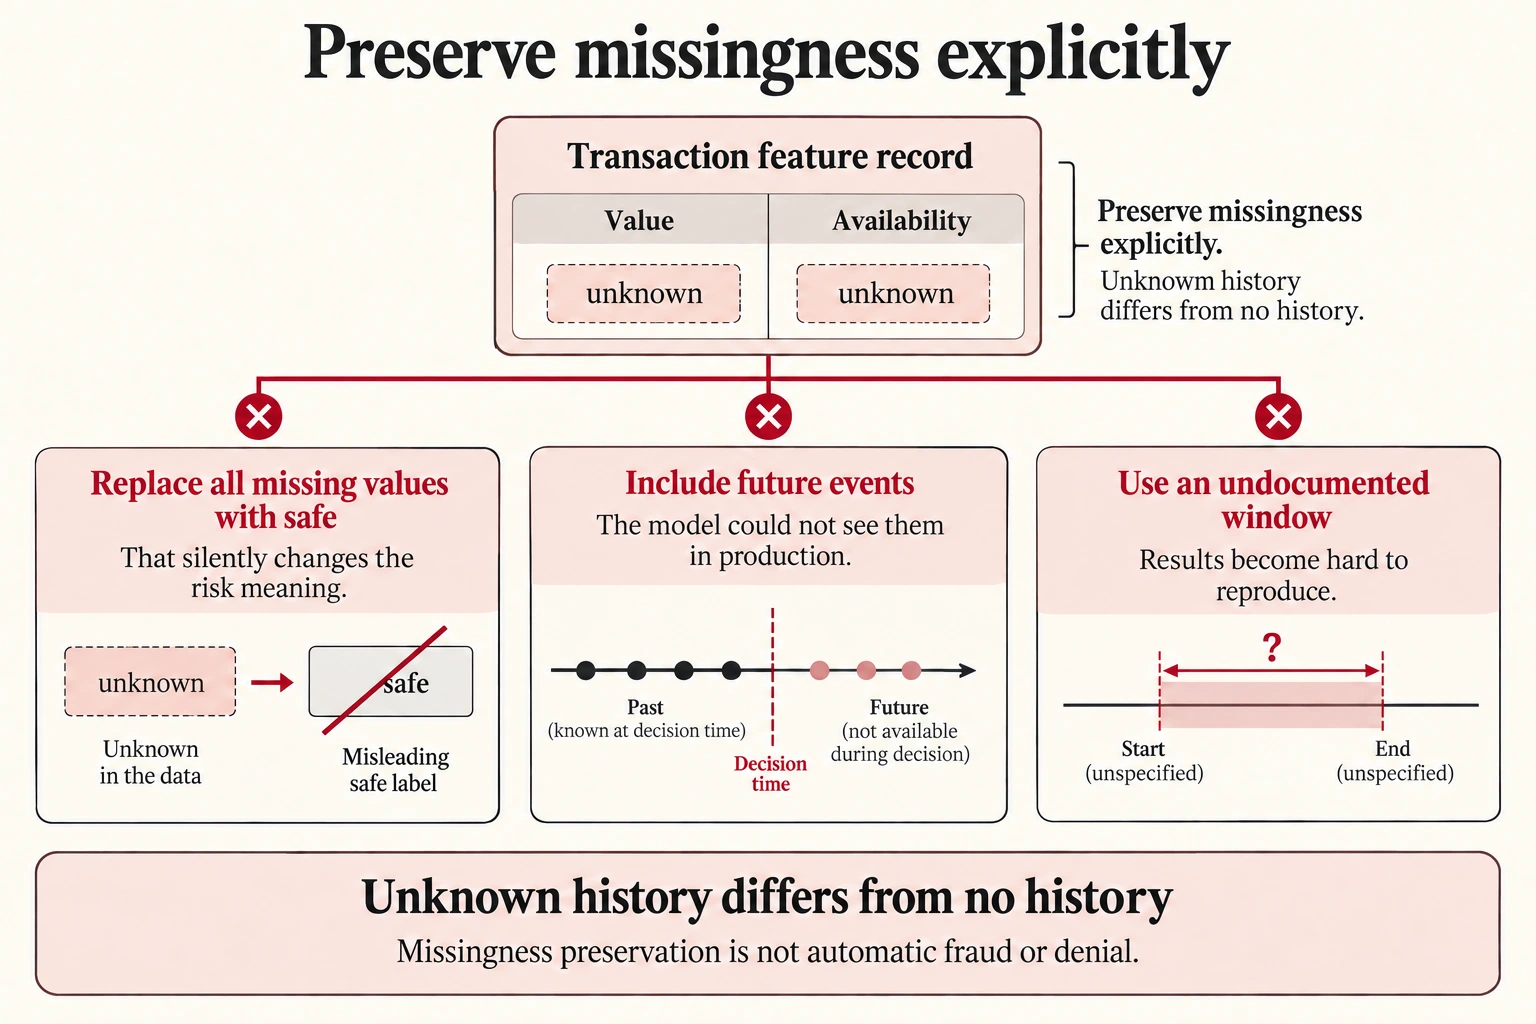
Enlarge to read every label and explore the connections
Diagram text
Control design. Preserve missingness explicitly. Unknown history differs from no history.
- Failure mode 1 — avoid
- Replace all missing values with safe. That silently changes the risk meaning.
- Failure mode 2 — avoid
- Include future events. The model could not see them in production.
- Failure mode 3 — avoid
- Use an undocumented window. Results become hard to reproduce.
Choose actions by expected consequence
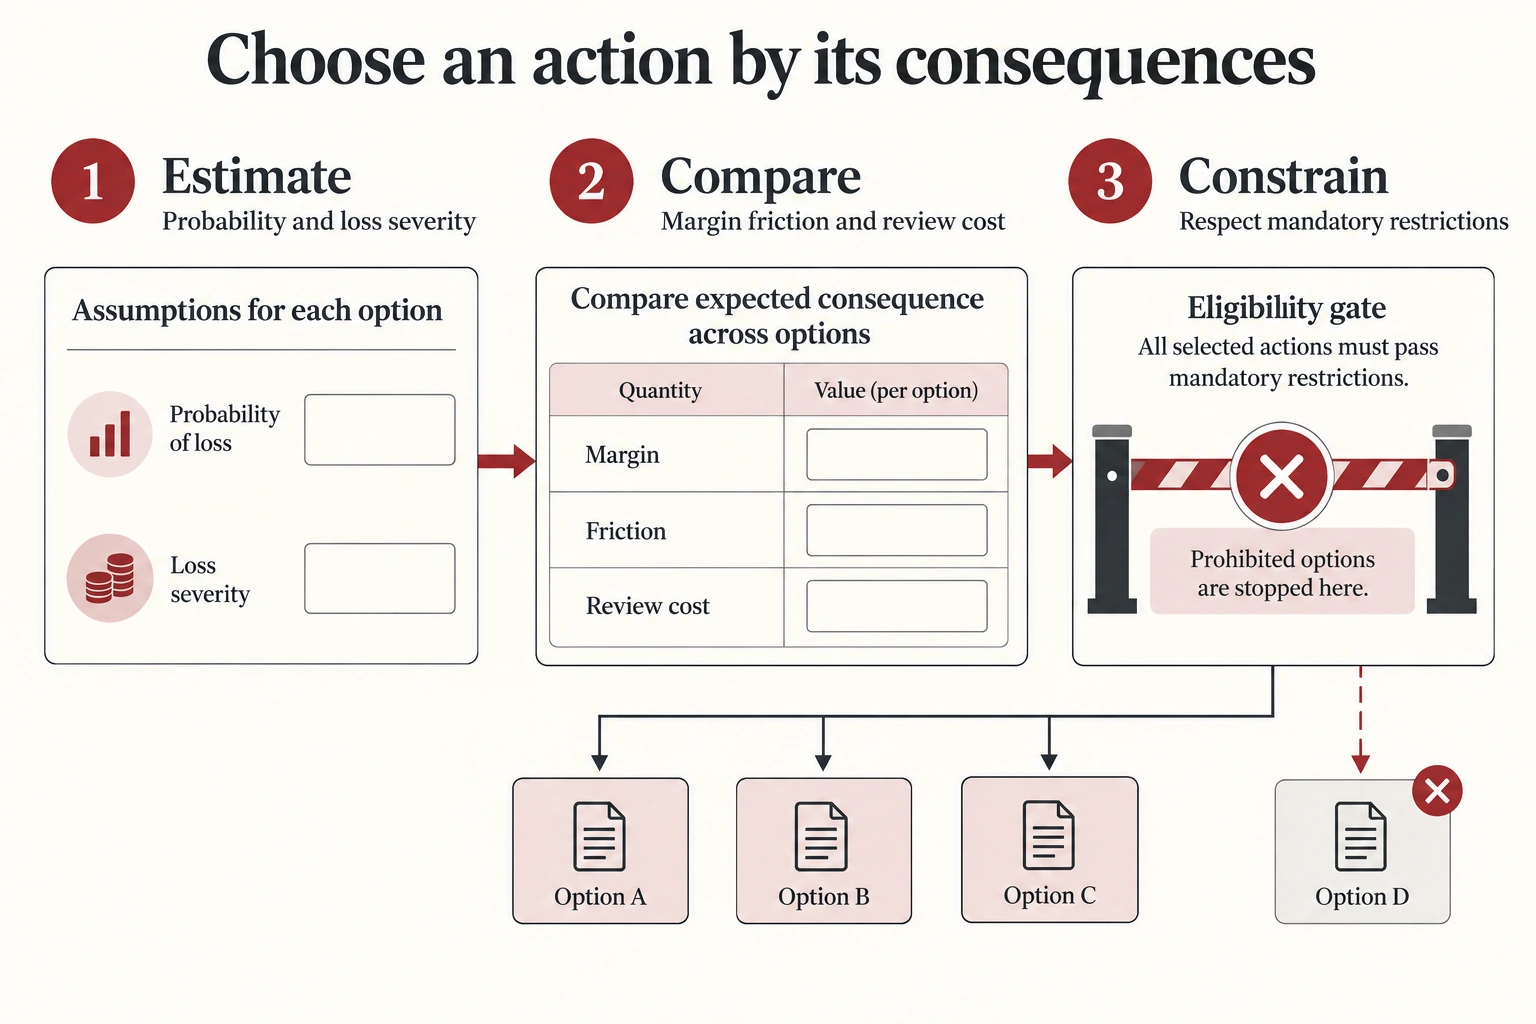
Enlarge to read every label and explore the connections
Diagram text
- Estimate. Probability and loss severity
- Compare. Margin friction and review cost
- Constrain. Respect mandatory restrictions
A score becomes useful when connected to an action. Compare expected fraud loss, margin, customer friction, review cost, and available evidence. The comparison is a decision aid, not permission to ignore legal restrictions. Mandatory prohibitions remain constraints.
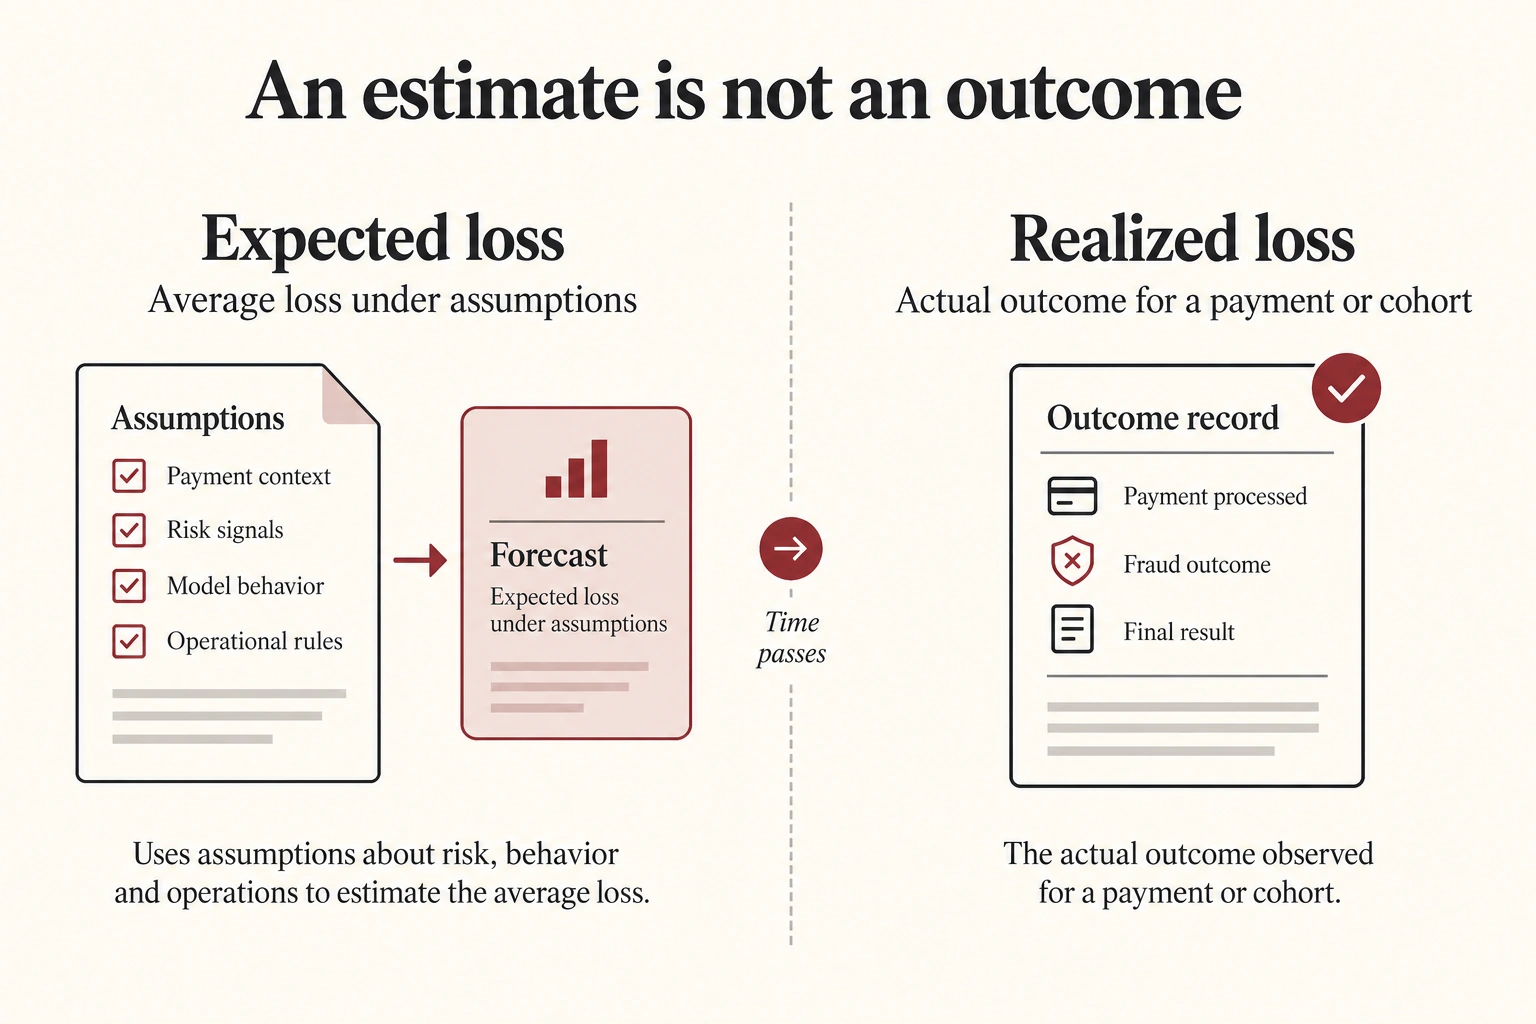
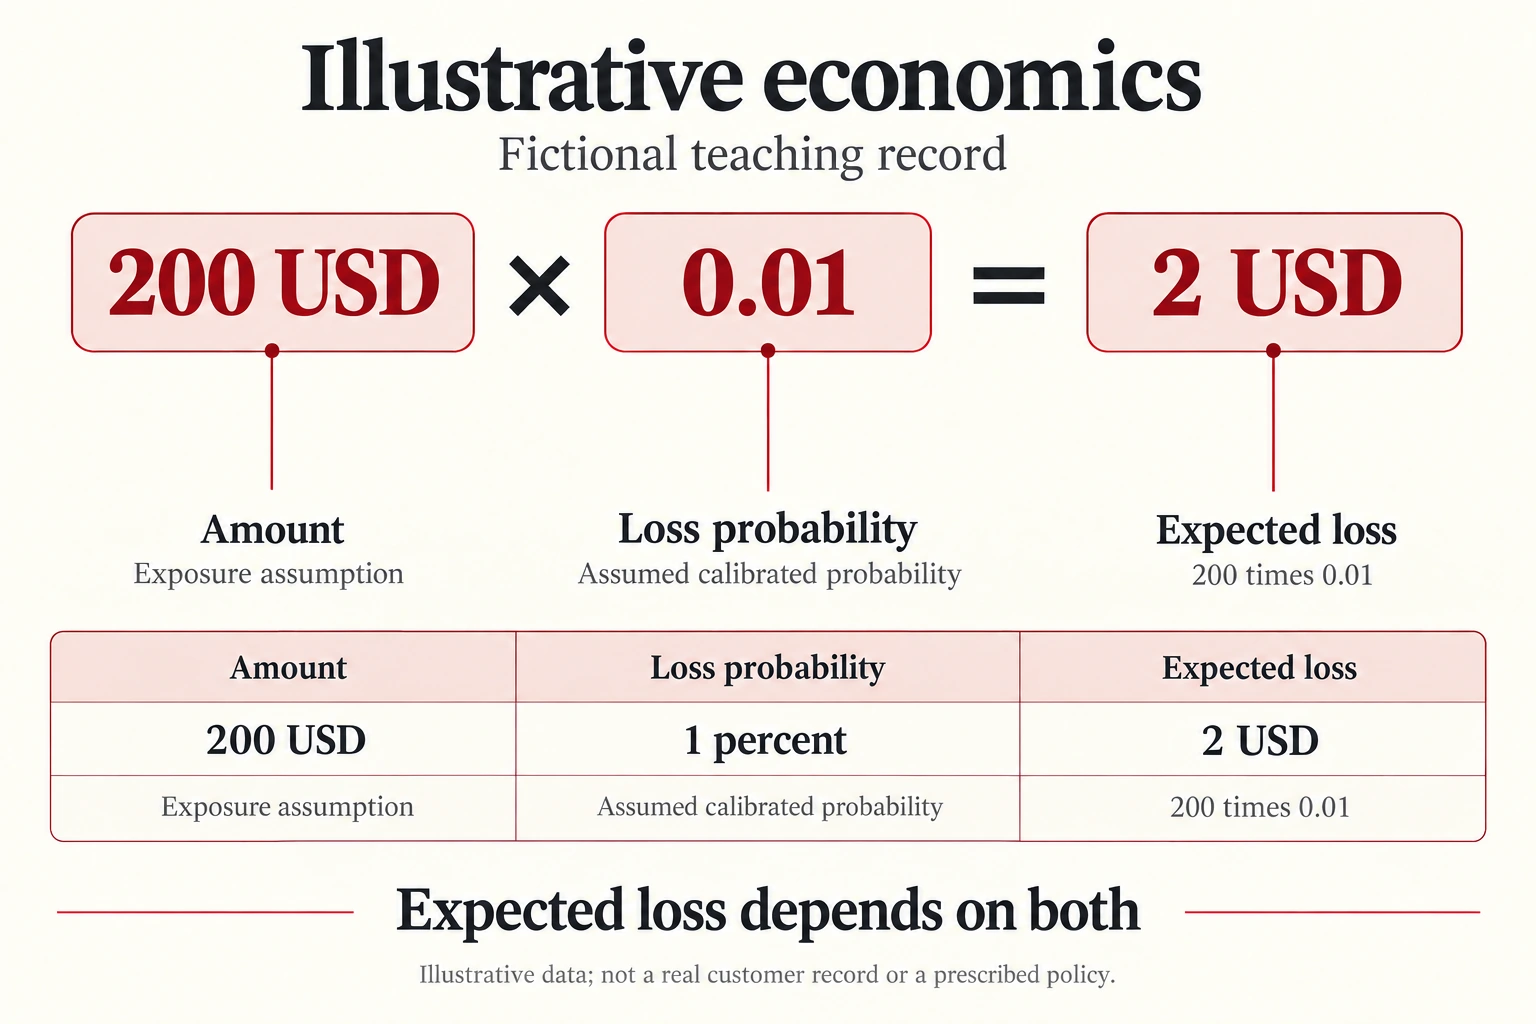
In a simple teaching example, a $200 payment with a 1 percent loss probability and full loss severity has $2 expected loss. If incremental contribution before risk is $6, the expected remainder is $4 before other costs. Change severity, recovery, or probability and the result changes. Never confuse expected value with a promise about one transaction.
Suppose a legitimate payment contributes $4 and a fraudulent payment can lose $100. A model score cannot be compared directly with either amount unless its probability meaning is established. Even with a calibrated probability, the decision also depends on how a review or authentication step changes outcomes. A challenge that prevents some losses may also cause good customers to leave. Estimate these effects separately and state which costs are missing from a simplified calculation.
The best action can differ for two payments with the same predicted probability. One may involve immediate delivery of a transferable asset; another may allow a shipment hold and reliable recovery. The model describes evidence about an outcome. The policy applies that evidence to the action available at this point in the transaction.
Inside the mechanism. Expected-consequence decisions combine probability, severity, intervention effectiveness, and customer or operating cost. A high probability on a tiny exposure can have a smaller expected loss than a moderate probability on a large exposure. Mandatory constraints remain separate from an economic trade-off. State the assumptions behind prevention and friction: a review may fail to prevent a loss, and a false positive may create delay without losing the entire purchase.
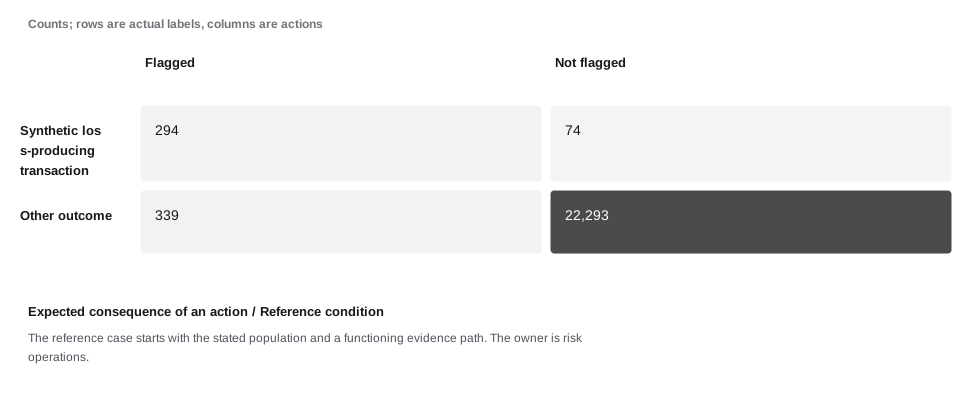
A concrete example. Two equally scored payments can have different recoverability and contribution. A policy uses those consequences rather than treating the score as the final answer. The rule flags 633 of 23,000 eligible transactions. Of those flags, 294 meet the synthetic target, giving 46.45% precision. It misses 74 target events. Under the stated cost assumptions, residual loss and operating friction total $72,389. The important result is the connection between the population, action, capacity, and outcome—not one isolated score.
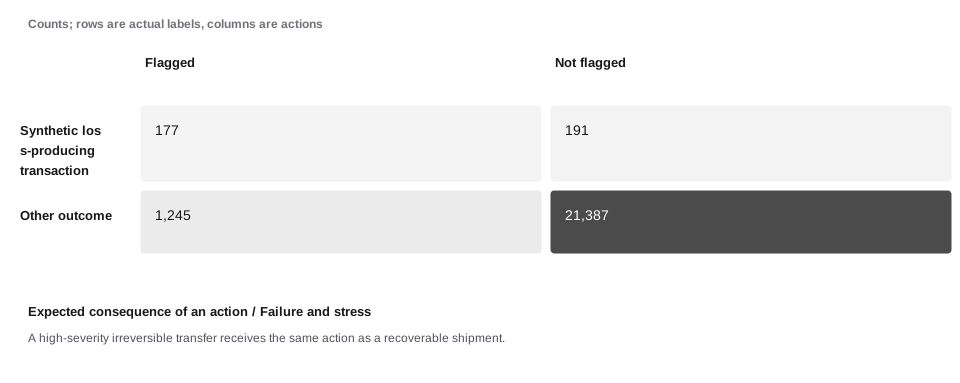
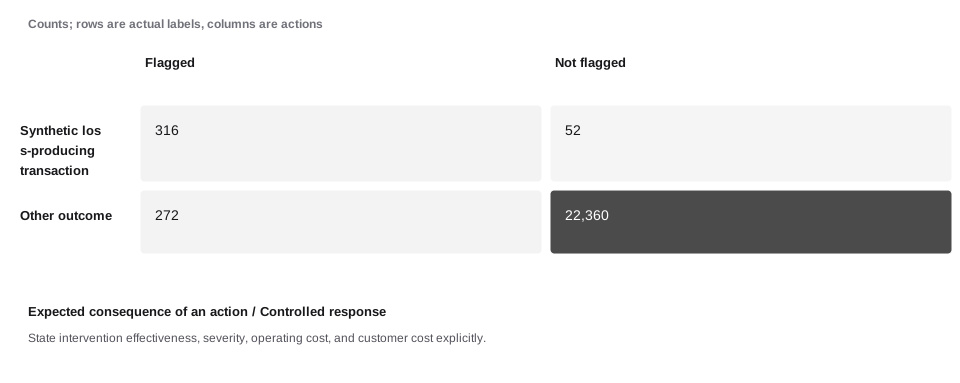
When the assumption fails. A high-severity irreversible transfer receives the same action as a recoverable shipment. State intervention effectiveness, severity, operating cost, and customer cost explicitly. The following worked sequence shows the reference condition, a stress condition, and a response condition with explicit synthetic data. These are comparative assumptions, not measured causal effects.
Two equally scored payments can have different recoverability and contribution. A policy uses those consequences rather than treating the score as the final answer.
Enlarge to read every label and explore the connections
Diagram text
- Expected loss
- Average loss under assumptions
- Realized loss
- Actual outcome for a payment or cohort
Enlarge to read every label and explore the connections
Diagram text
Illustrative data; not a real customer record or a prescribed policy.
- Amount: 200 USD
- Exposure assumption
- Loss probability: 1 percent
- Assumed calibrated probability
- Expected loss: 2 USD
- 200 times 0.01
Expected loss depends on both
Enlarge to read every label and explore the connections
Diagram text
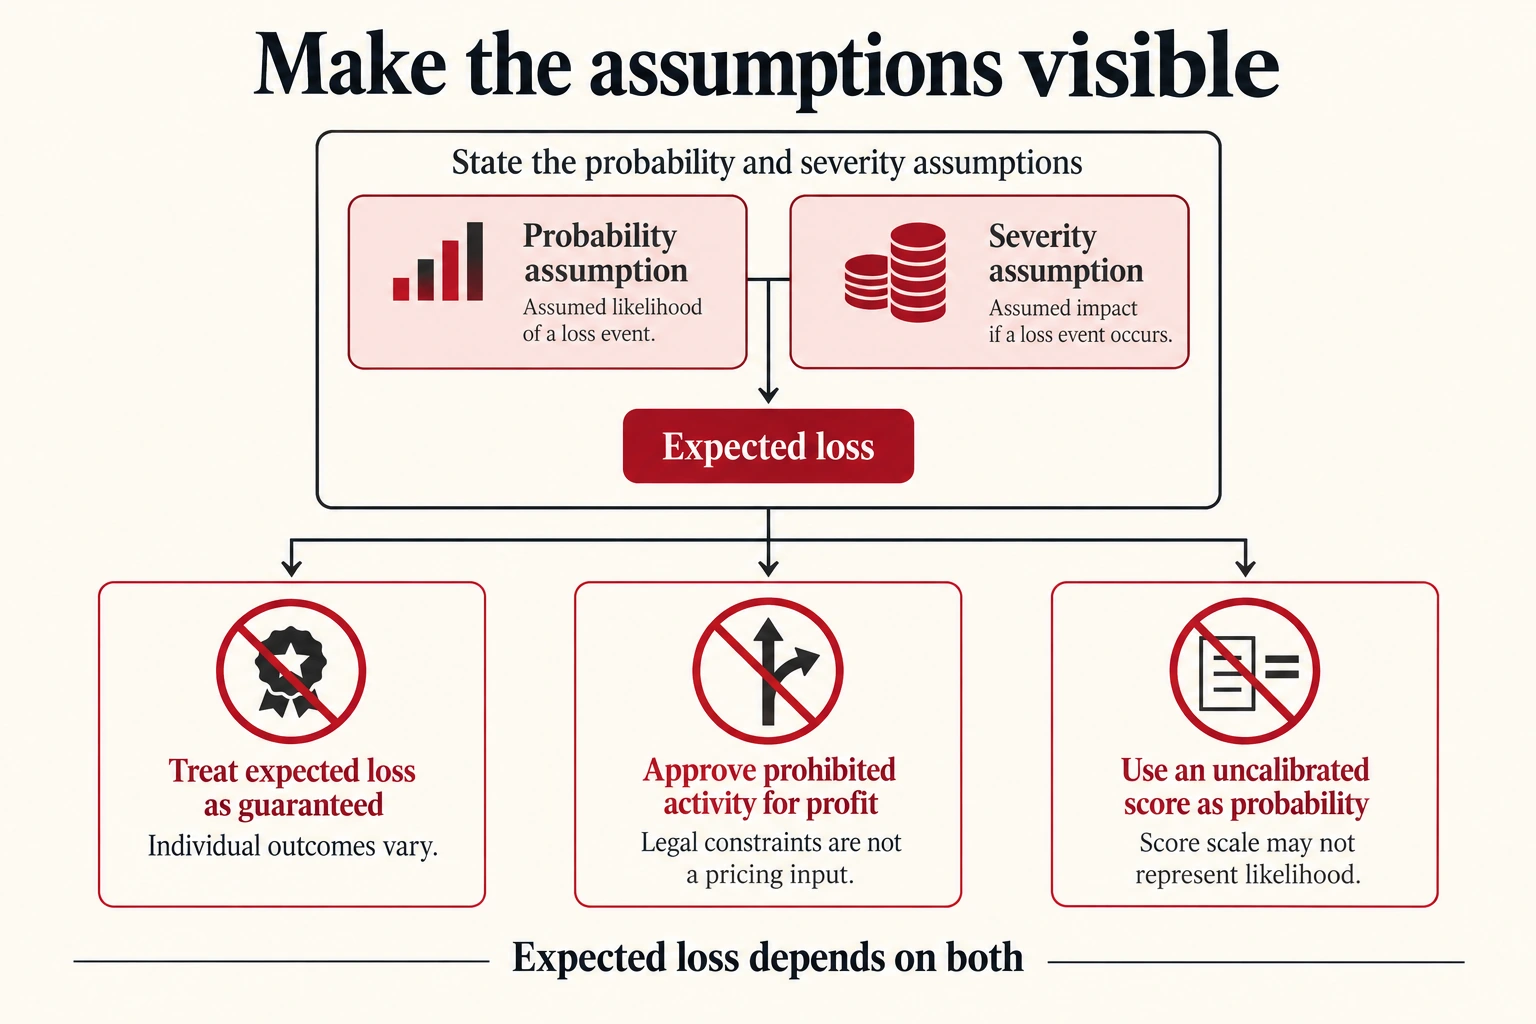
Control design. State the probability and severity assumptions. Expected loss depends on both.
- Failure mode 1 — avoid
- Treat expected loss as guaranteed. Individual outcomes vary.
- Failure mode 2 — avoid
- Approve prohibited activity for profit. Legal constraints are not a pricing input.
- Failure mode 3 — avoid
- Use an uncalibrated score as probability. Score scale may not represent likelihood.
Use a ladder of interventions
Enlarge to read every label and explore the connections
Diagram text
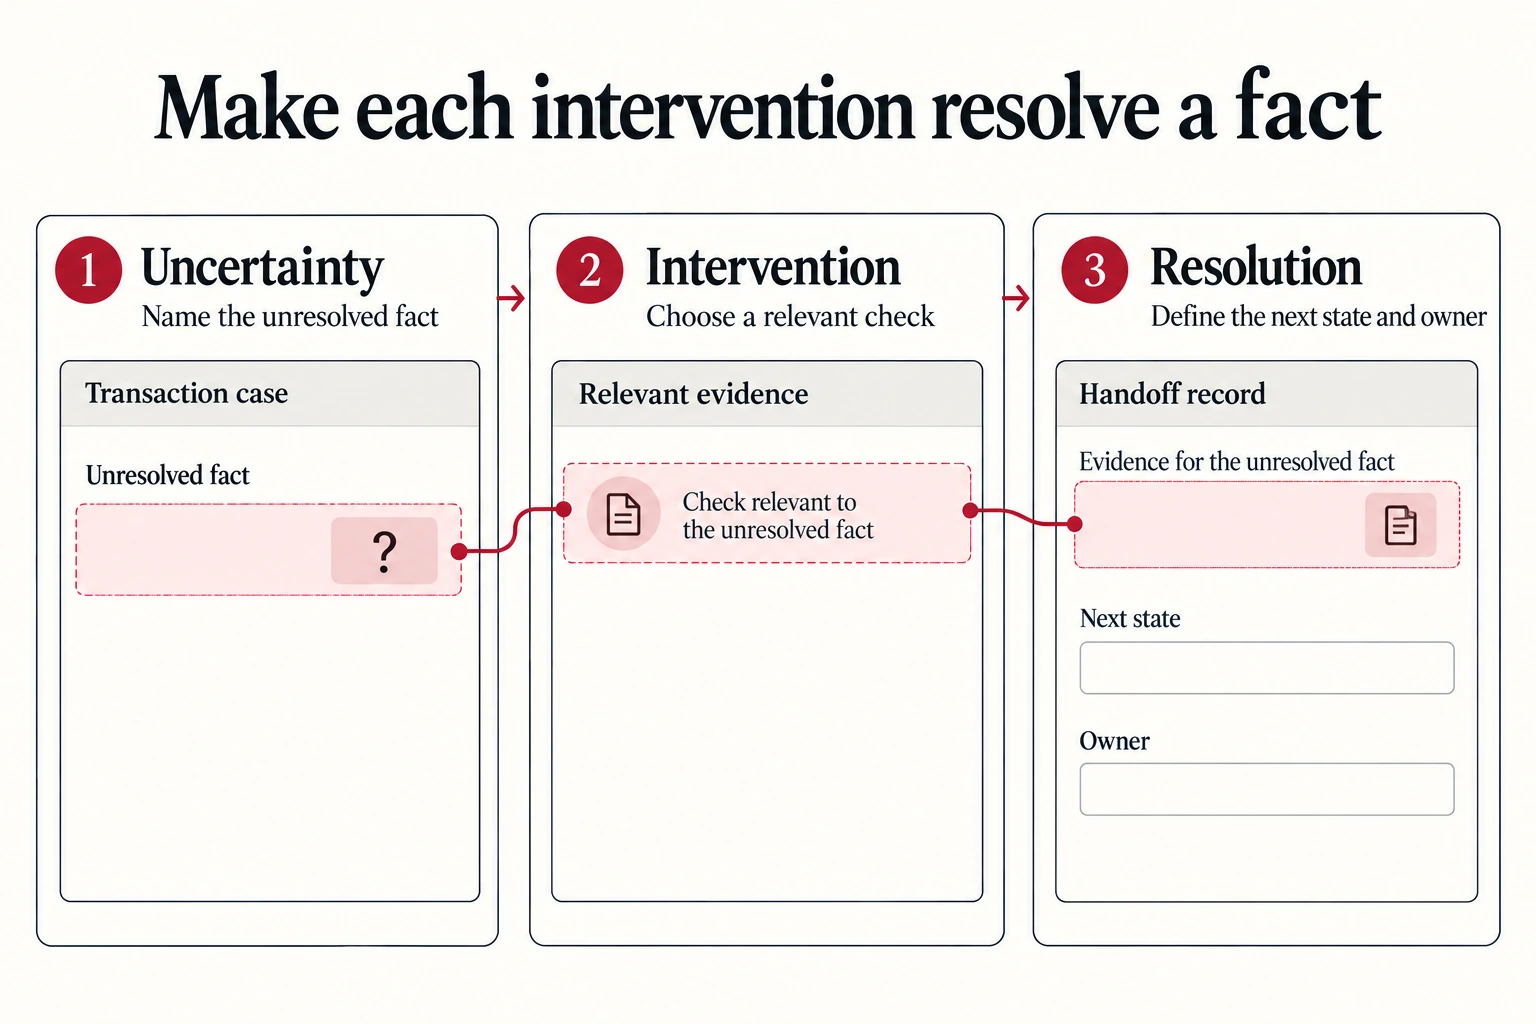
- Uncertainty. Name the unresolved fact
- Intervention. Choose a relevant check
- Resolution. Define the next state and owner
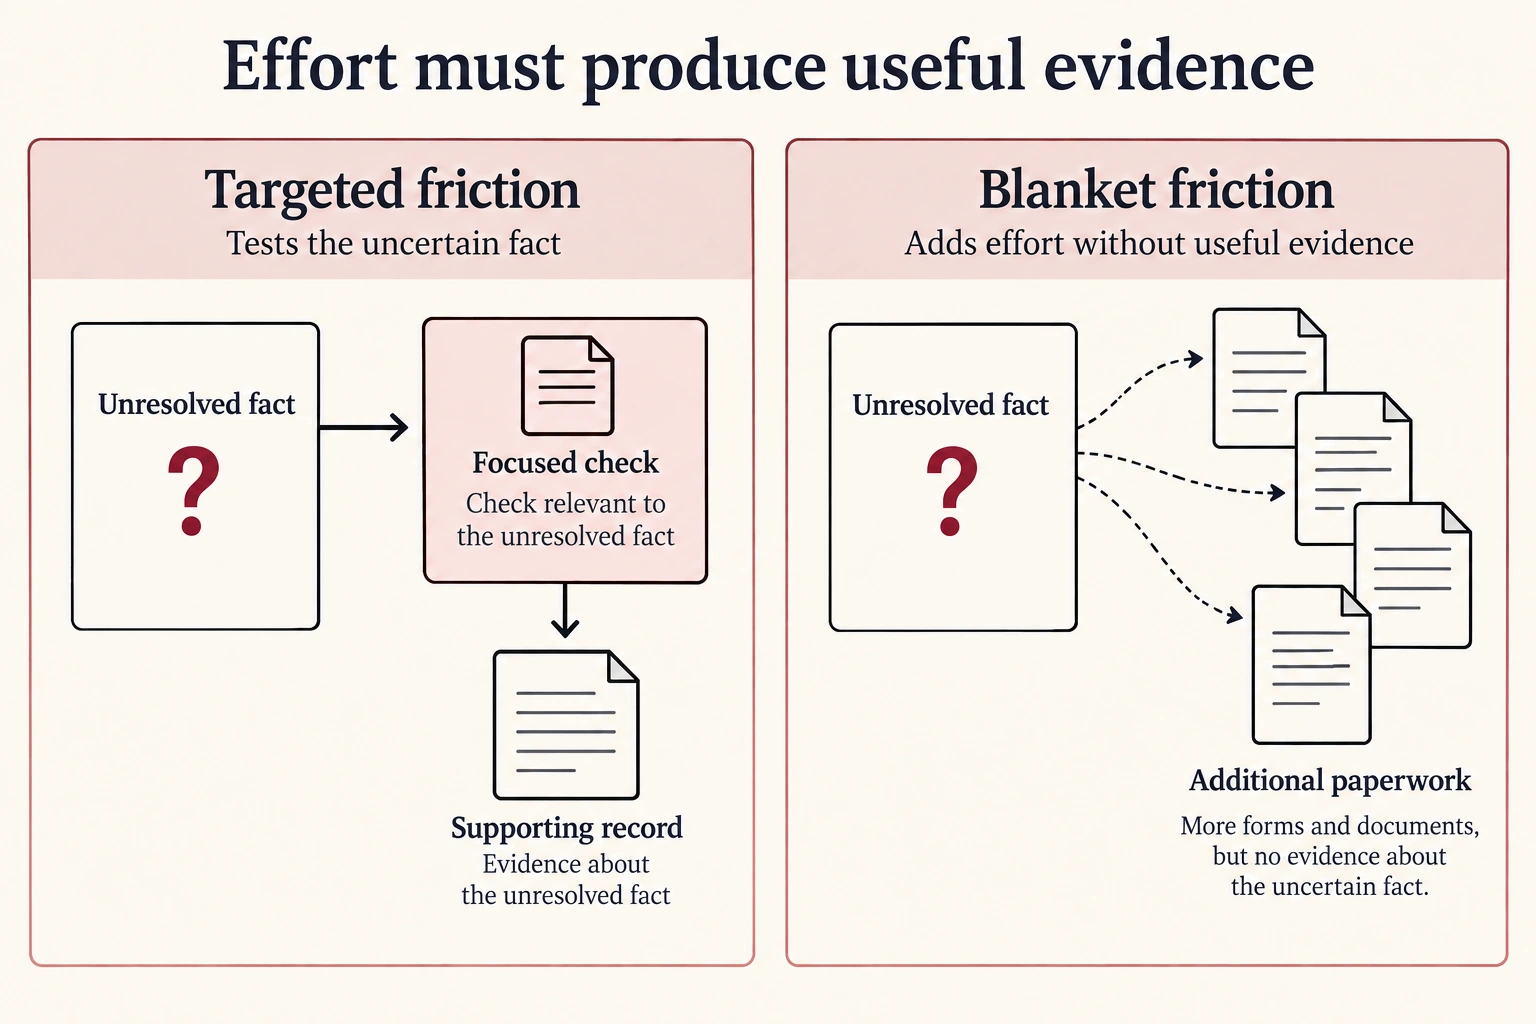
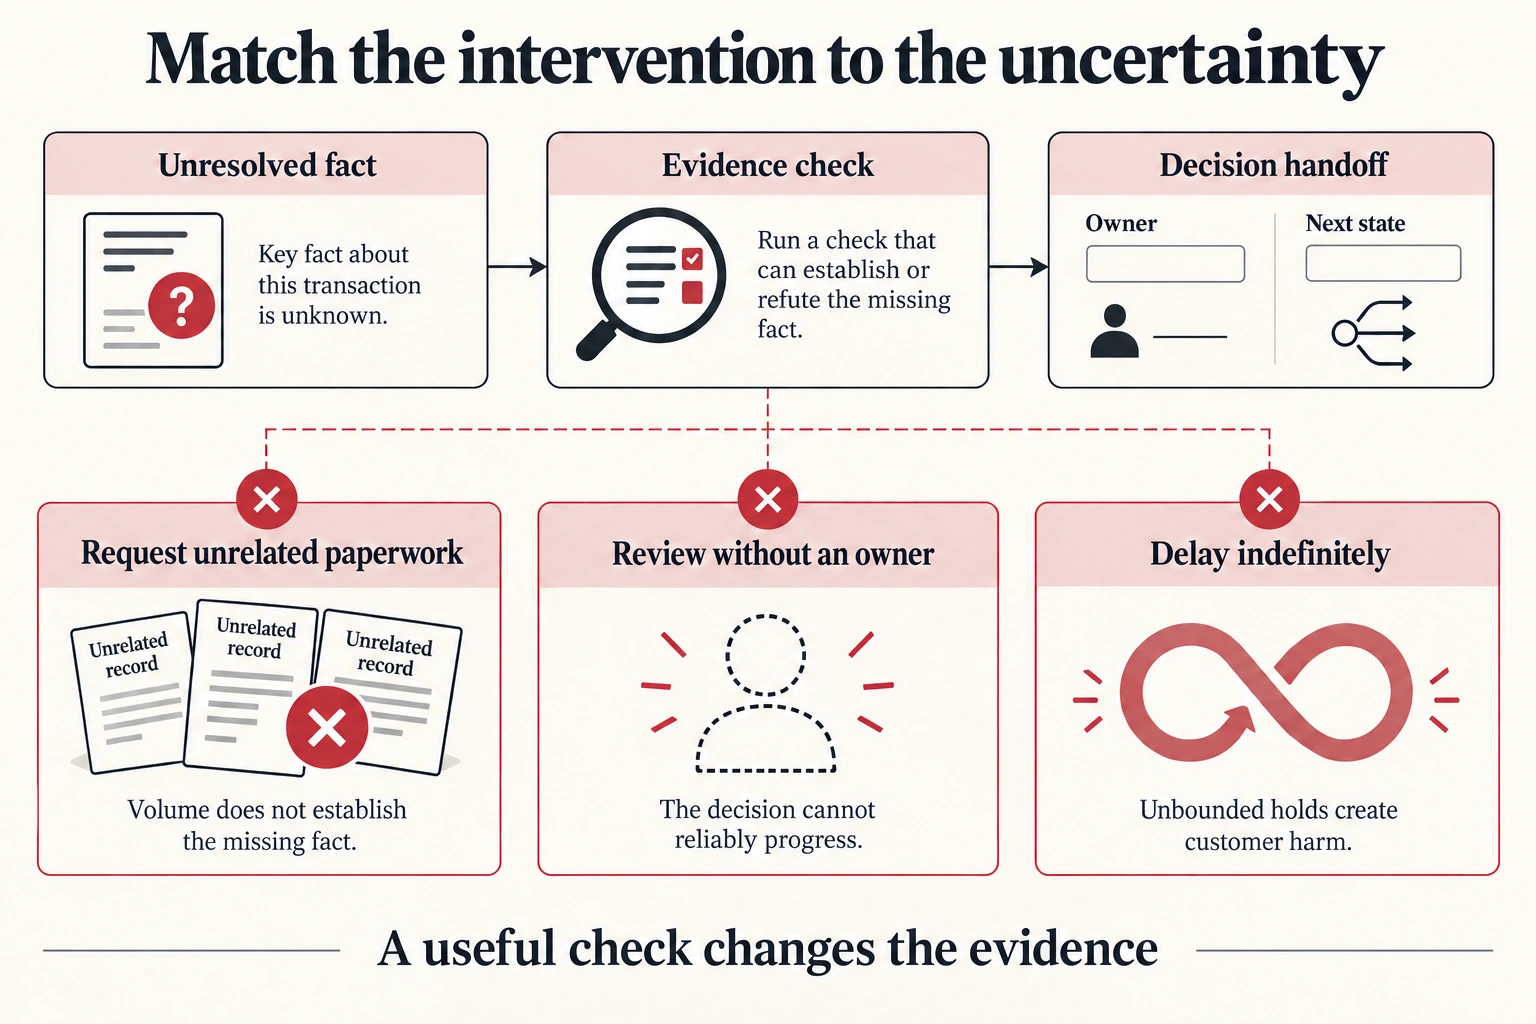
Approve, request stronger evidence, review, limit, delay, and decline have different effects. Select an action that can reduce the specific uncertainty before harm occurs. A document request does little for a suspected compromised session if it does not test current control.
Each intervention needs a completion route. Set a queue owner, timeout, and permitted customer actions. Measure whether the intervention produces useful evidence. If nearly every review ends in approval without new information, the queue may be an expensive delay. If reviewers lack authority to act, the queue is a storage system for unresolved risk.
Inside the mechanism. An intervention ladder can include observation, a narrower limit, an evidence request, a scoped hold, review, or rejection. Each action needs a permitted scope and an owner for unresolved outcomes. More friction is not automatically more protection. If a challenge collects evidence unrelated to the suspected mechanism, it can inconvenience legitimate users while leaving the loss path intact. Evaluate the action actually delivered, including bypasses and timeouts.
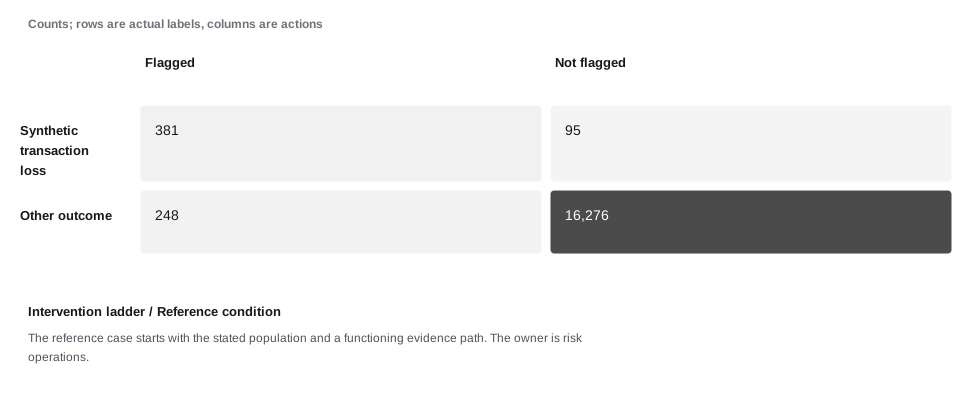
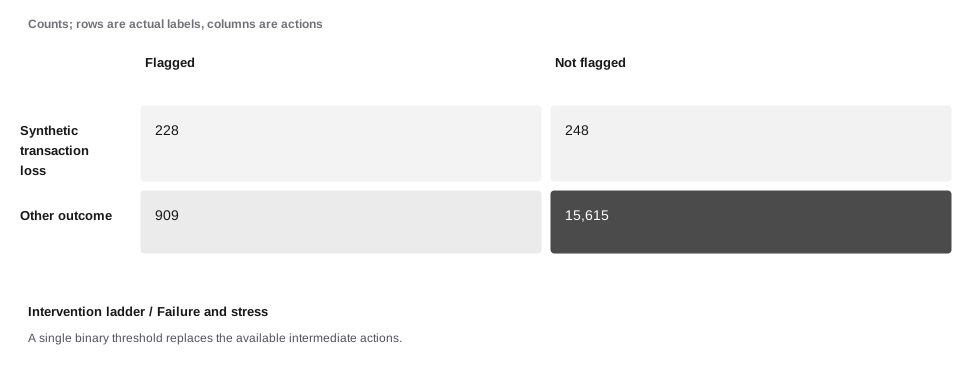
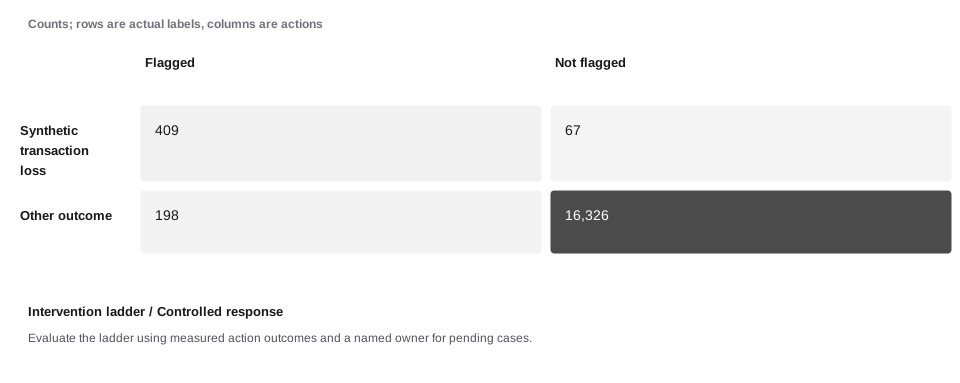
A concrete example. The product can allow, request evidence, hold fulfillment, route review, or decline under the appropriate policy. Each action changes both risk and customer experience. The rule flags 629 of 17,000 intervention-eligible attempts. Of those flags, 381 meet the synthetic target, giving 60.57% precision. It misses 95 target events. Under the stated cost assumptions, residual loss and operating friction total $31,027. The important result is the connection between the population, action, capacity, and outcome—not one isolated score.
When the assumption fails. A single binary threshold replaces the available intermediate actions. Evaluate the ladder using measured action outcomes and a named owner for pending cases. The following worked sequence shows the reference condition, a stress condition, and a response condition with explicit synthetic data. These are comparative assumptions, not measured causal effects.
The product can allow, request evidence, hold fulfillment, route review, or decline under the appropriate policy. Each action changes both risk and customer experience.
Enlarge to read every label and explore the connections
Diagram text
- Targeted friction
- Tests the uncertain fact
- Blanket friction
- Adds effort without useful evidence
Enlarge to read every label and explore the connections
Diagram text
Illustrative data; not a real customer record or a prescribed policy.
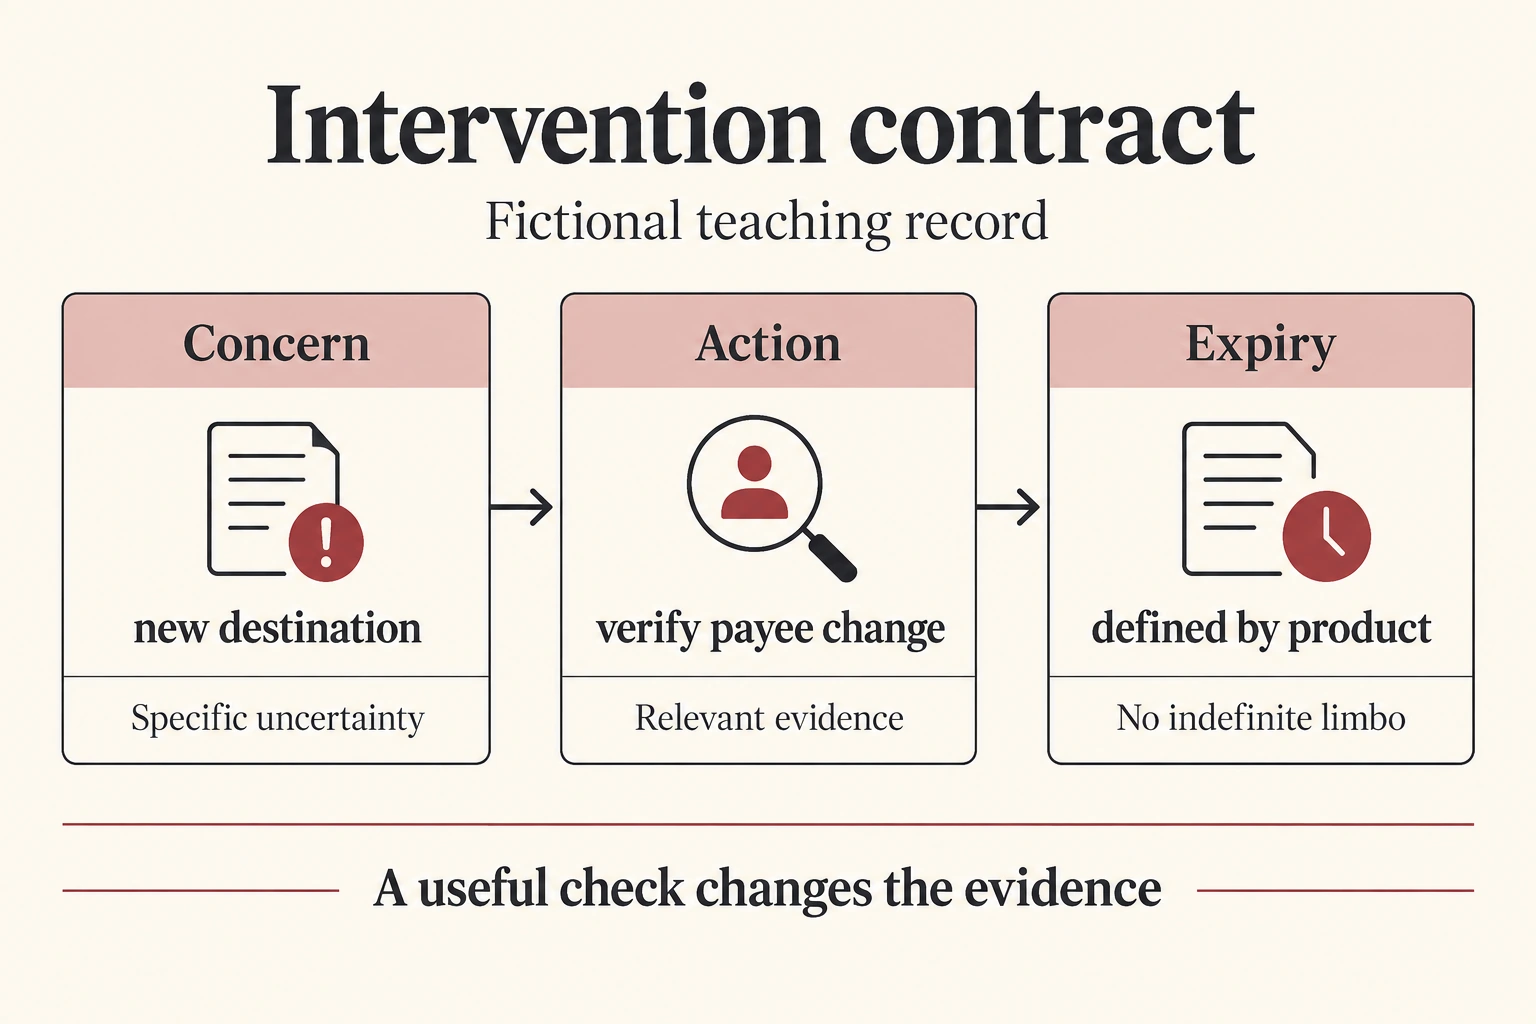
- Concern: new destination
- Specific uncertainty
- Action: verify payee change
- Relevant evidence
- Expiry: defined by product
- No indefinite limbo
A useful check changes the evidence
Enlarge to read every label and explore the connections
Diagram text
Control design. Match the intervention to the uncertainty. A useful check changes the evidence.
- Failure mode 1 — avoid
- Request unrelated paperwork. Volume does not establish the missing fact.
- Failure mode 2 — avoid
- Review without an owner. The decision cannot reliably progress.
- Failure mode 3 — avoid
- Delay indefinitely. Unbounded holds create customer harm.
Evaluate what the control misses
Enlarge to read every label and explore the connections
Diagram text
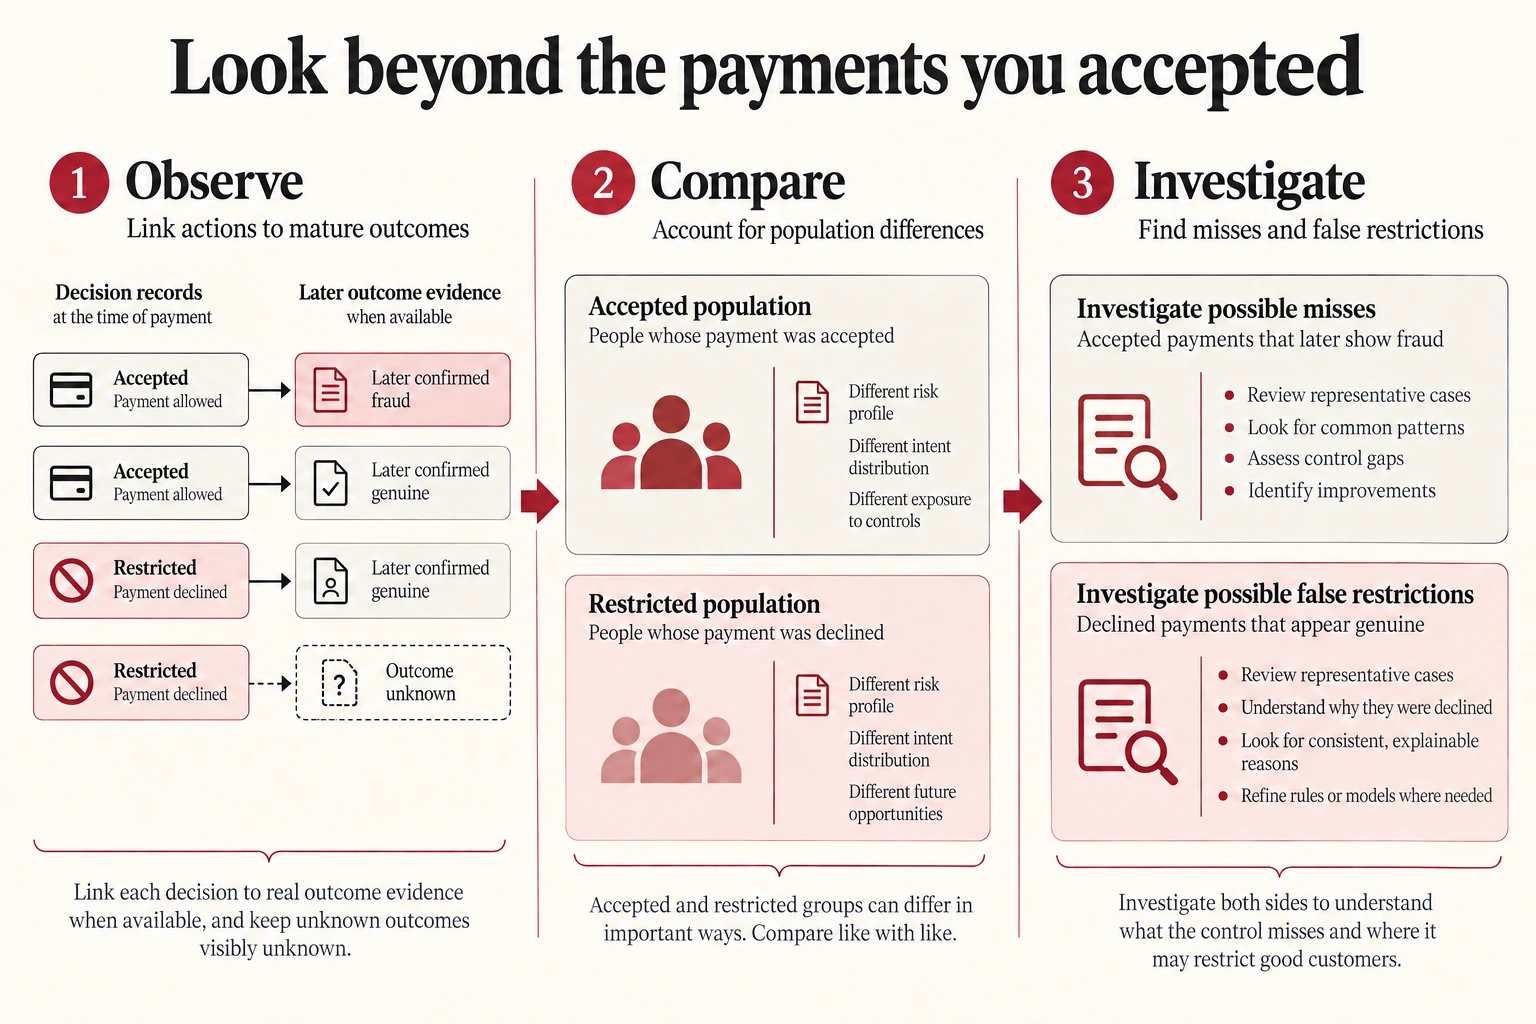
- Observe. Link actions to mature outcomes
- Compare. Account for population differences
- Investigate. Find misses and false restrictions
Observed loss is shaped by prior decisions. Declined payments do not produce the same outcomes as approved payments. A policy can appear safe simply because it refuses nearly everything. Compare loss with approval, customer impact, and the composition of traffic.
Use controlled evaluation where lawful and suitable, and analyze uncertainty when labels are unavailable. Review false positives through appeals and representative samples. Monitor the loss distribution, not just an average. A stable average can hide a new high-loss segment. Every metric should have an owner who knows its denominator and its blind spots.
A decline policy hides part of its own outcome. A stopped transaction cannot reveal exactly what would have happened if the platform had allowed it. Counting every decline as prevented fraud rewards aggressive controls regardless of customer harm. Use reviewed samples, mature outcomes, and carefully governed evaluation methods to estimate the blind spots. Keep measured results separate from assumed prevention. A dashboard becomes more useful when it shows uncertainty than when it gives an unsupported precise savings total.
Inside the mechanism. Detection performance requires some evidence about missed outcomes, not only the cases the control selected. Mature downstream loss, structured quality samples, and supported external reports can reveal gaps, each with its own selection limits. Record the population from which labels came. A reviewer-confirmed precision estimate says something about selected alerts; it does not by itself establish recall across all transactions or the causal loss avoided by the policy.
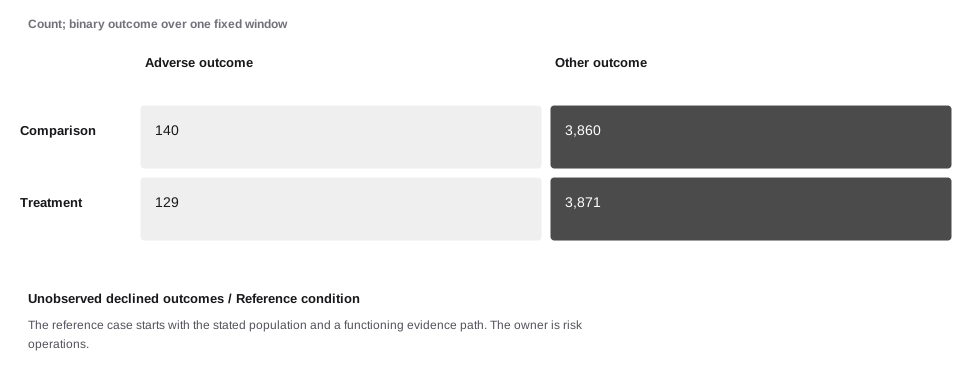
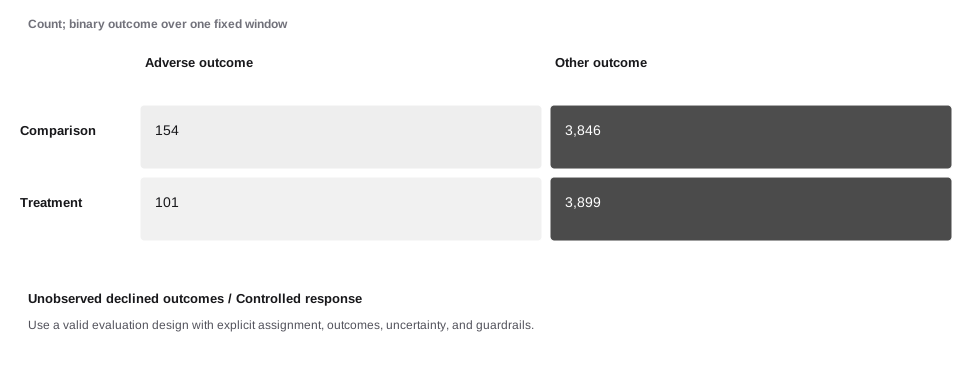
A concrete example. A stopped transaction cannot reveal the exact result that would have followed approval. Counting every decline as fraud prevention creates a selected success metric. The comparison arm has 140/4000 adverse outcomes (3.50%) and the treatment arm has 129/4000 (3.23%). The absolute difference is -0.28 percentage points, with an illustrative large-sample 95% interval from -1.07 to 0.52. Interpretation depends on assignment integrity, outcome maturity, independence, and the actual decision being evaluated.
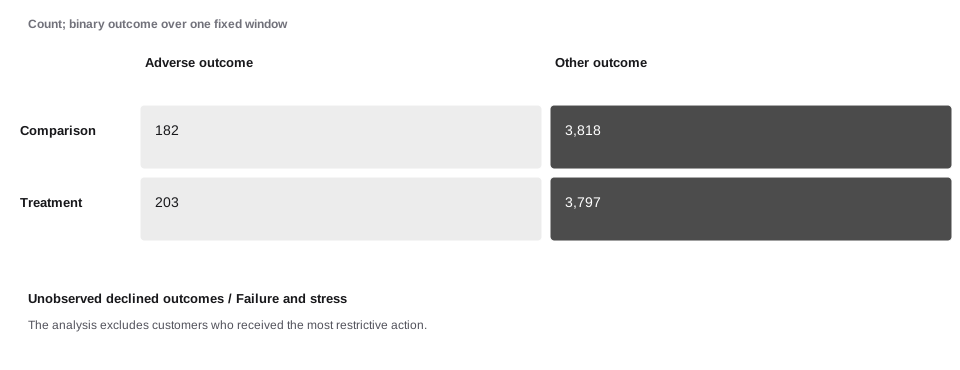
When the assumption fails. The analysis excludes customers who received the most restrictive action. Use a valid evaluation design with explicit assignment, outcomes, uncertainty, and guardrails. The following worked sequence shows the reference condition, a stress condition, and a response condition with explicit synthetic data. These are comparative assumptions, not measured causal effects.
A stopped transaction cannot reveal the exact result that would have followed approval. Counting every decline as fraud prevention creates a selected success metric.
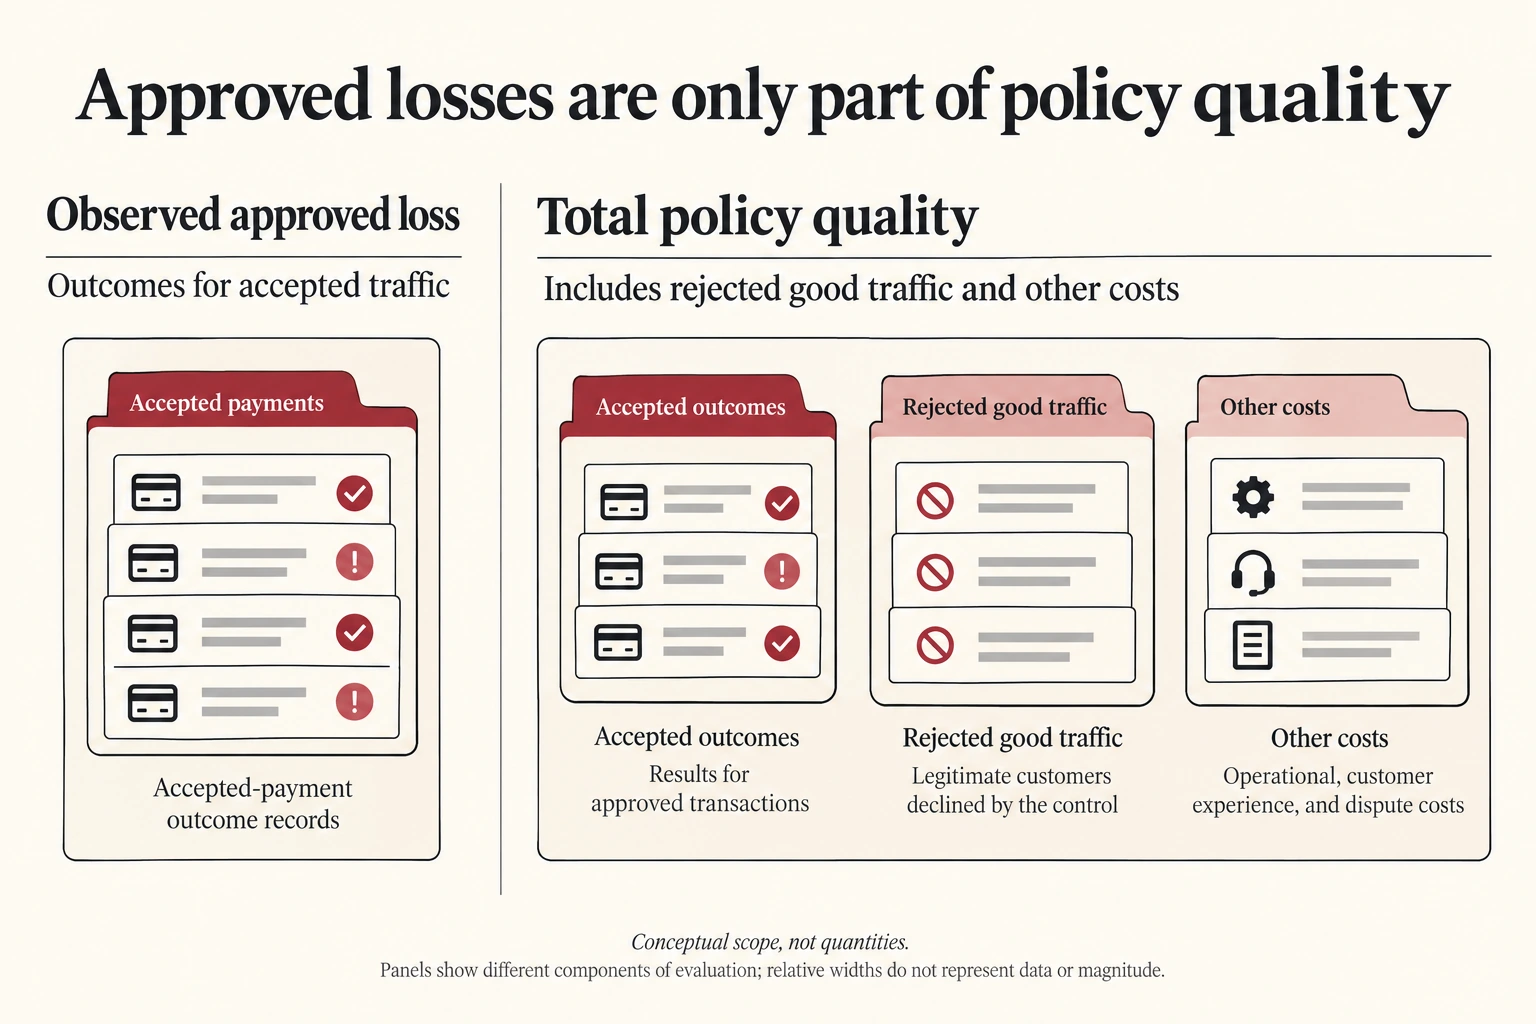
Enlarge to read every label and explore the connections
Diagram text
- Observed approved loss
- Outcomes for accepted traffic
- Total policy quality
- Includes rejected good traffic and other costs
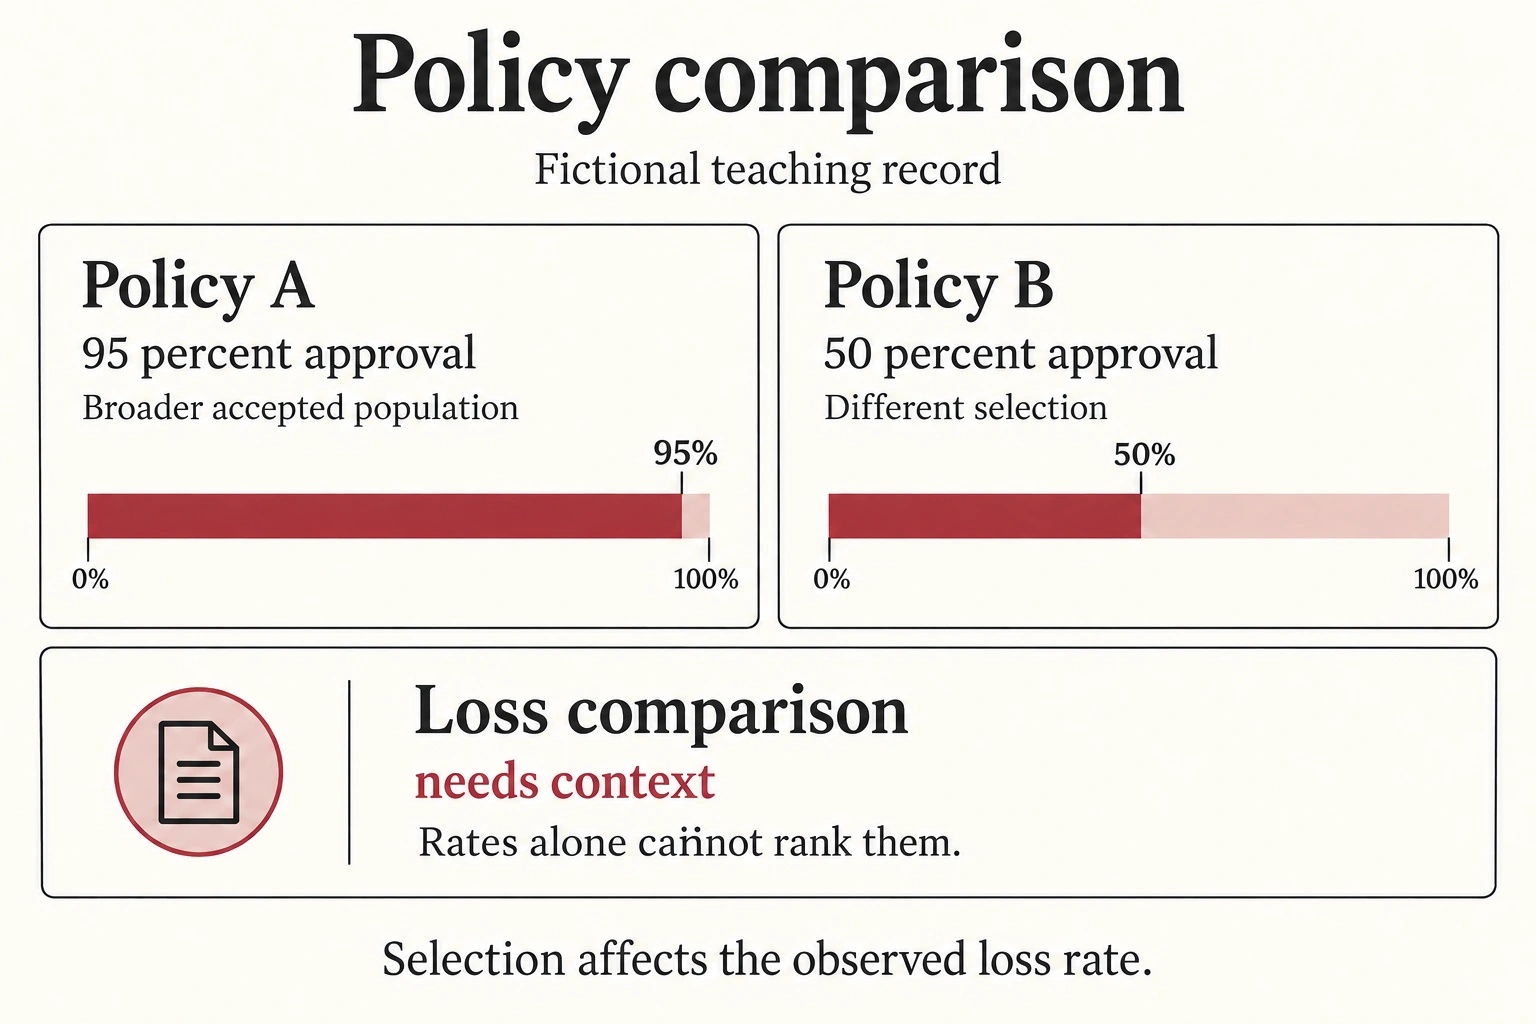
Enlarge to read every label and explore the connections
Diagram text
Illustrative data; not a real customer record or a prescribed policy.
- Policy A: 95 percent approval
- Broader accepted population
- Policy B: 50 percent approval
- Different selection
- Loss comparison: needs context
- Rates alone cannot rank them
Selection affects the observed loss rate
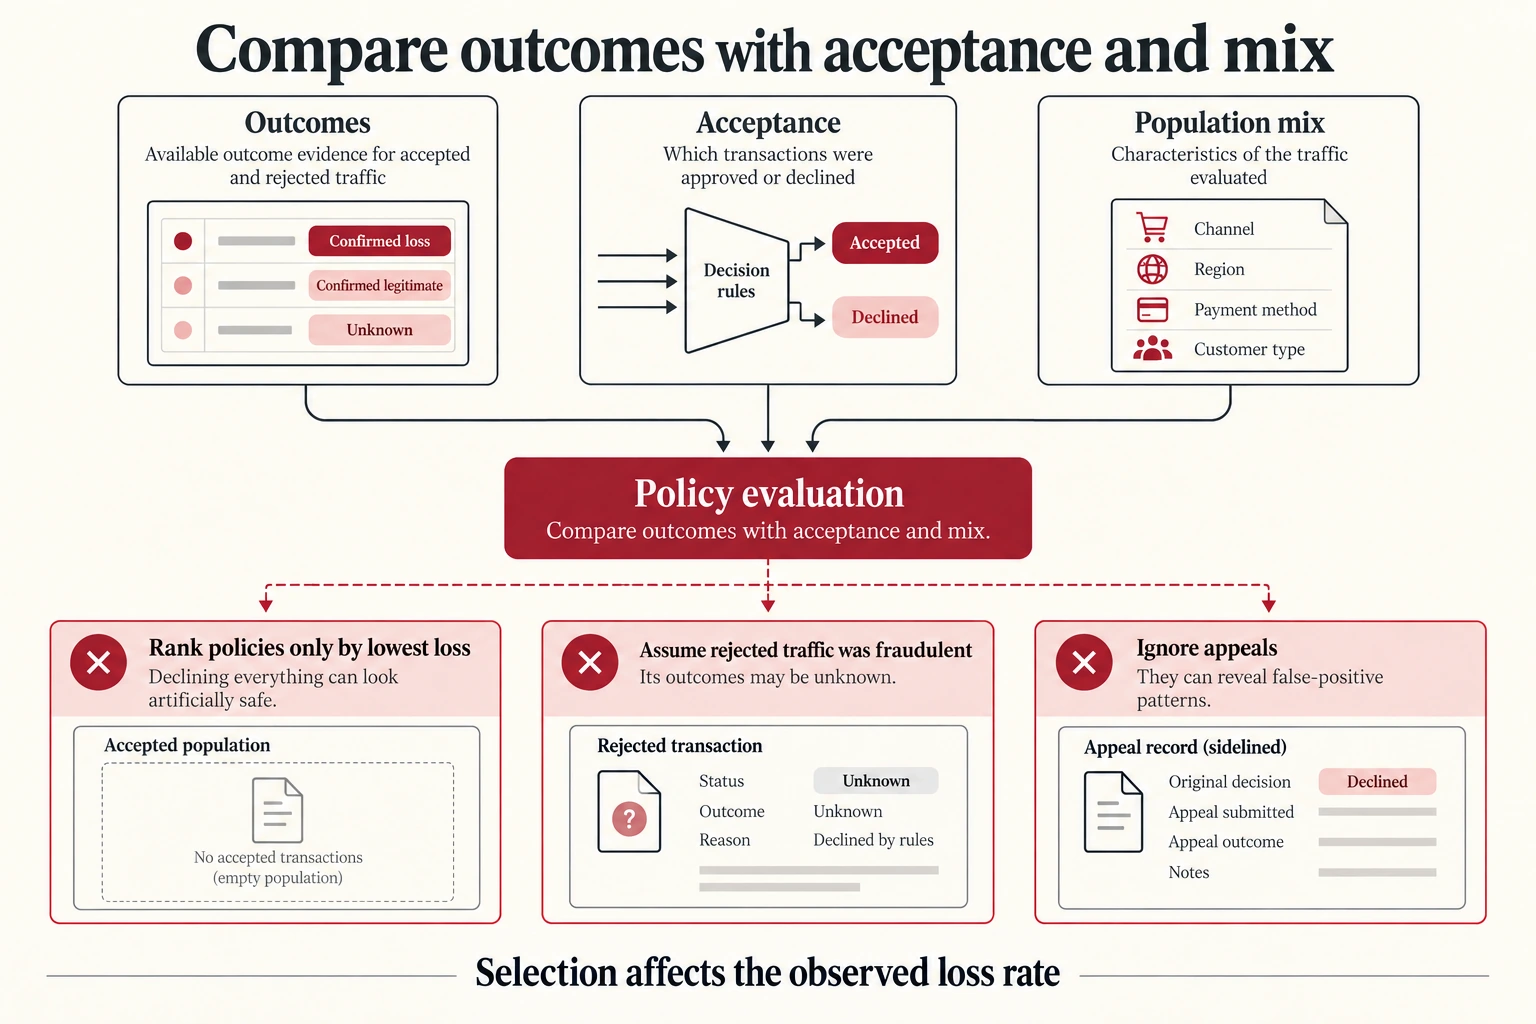
Enlarge to read every label and explore the connections
Diagram text
Control design. Compare outcomes with acceptance and mix. Selection affects the observed loss rate.
- Failure mode 1 — avoid
- Rank policies only by lowest loss. Declining everything can look artificially safe.
- Failure mode 2 — avoid
- Assume rejected traffic was fraudulent. Its outcomes may be unknown.
- Failure mode 3 — avoid
- Ignore appeals. They can reveal false-positive patterns.
Chapter connections
This chapter builds on Account takeover and account recovery. Continue with Scams, money mules, and social engineering to follow the next part of the system. Use the glossary for terminology and risk mathematics for formulas and worked calculations.