
Transaction monitoring and alert quality
Design scenarios that connect a risk hypothesis to evidence.
Context turns a signal into a useful alert
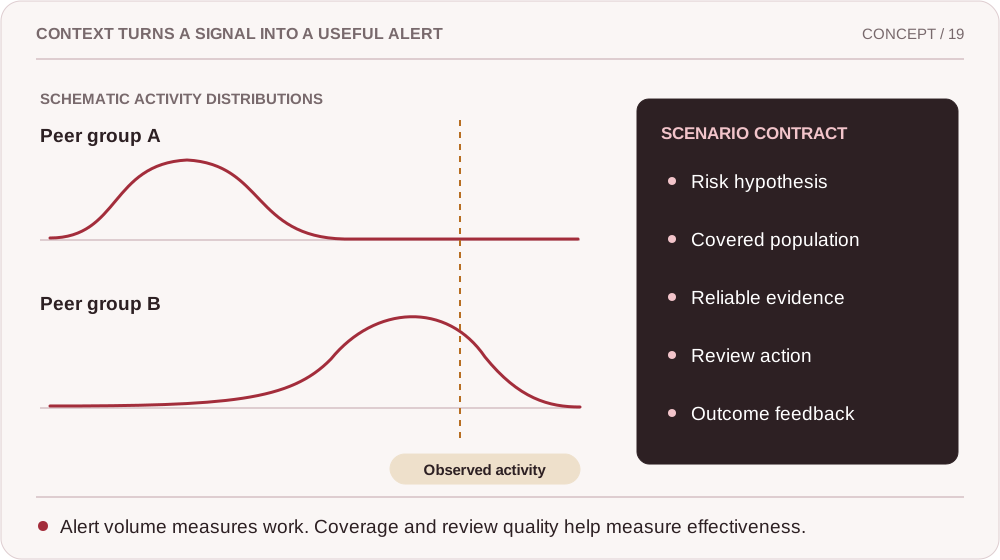
Enlarge to read every label and explore the connections
Compare activity with an appropriate peer group and customer story. A rule threshold is only one part of a monitoring scenario.
Read the two peer distributions separately.
Compare the same observed activity in each.
Connect the signal to a review that can change a decision.
The monitoring rule has a name, a threshold, and an owner. It still does not have a reason to exist. A useful scenario begins with a risk hypothesis and ends with a review that can change a decision.
Write the hypothesis before the rule
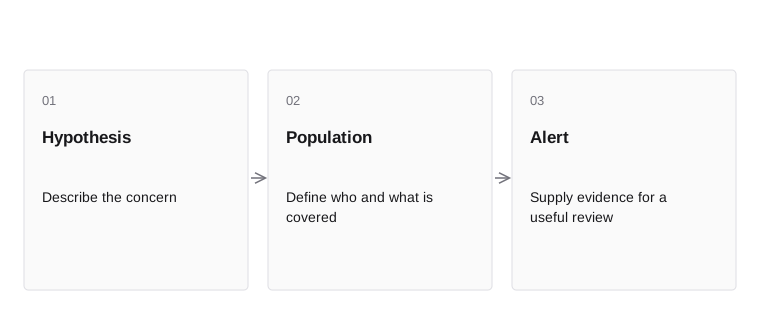
- HypothesisDescribe the concern
- PopulationDefine who and what is covered
- AlertSupply evidence for a useful review
A monitoring scenario should explain the activity of concern, the covered population, the evidence used, and the action an alert enables. Start with the risk assessment. A rule copied from another business may monitor a pattern that is normal in yours.
Keep the scenario rationale separate from implementation details. The rationale might concern unexplained movement inconsistent with a customer’s business. The implementation uses defined features and windows to find candidates. If the data cannot support the hypothesis, improve the data or narrow the claim. Do not make the threshold carry meaning it does not have.
A monitoring hypothesis explains what pattern could matter and why. It identifies the activity, the relevant customer population, the observation window, and the evidence needed for review. The rule is one implementation of that hypothesis. A threshold without the underlying explanation is difficult to tune because a change in alert count does not reveal whether the intended coverage improved.
Suppose a scenario looks for activity inconsistent with a newly opened business profile. The engineer must define what counts as the start of the relationship, how profile changes enter the calculation, and how late events affect the window. The investigator must know which facts caused the alert and which expected information is absent. Both roles depend on a shared, testable definition.
Inside the mechanism. A monitoring hypothesis states the behavior of concern, the observable evidence, the eligible population, and plausible legitimate explanations. Translate it into a rule only after those elements are clear. A threshold crossing is then a selection event for a defined purpose, not a declaration of criminal activity. Keep the rule version and the inputs that caused selection so the case can be reproduced.
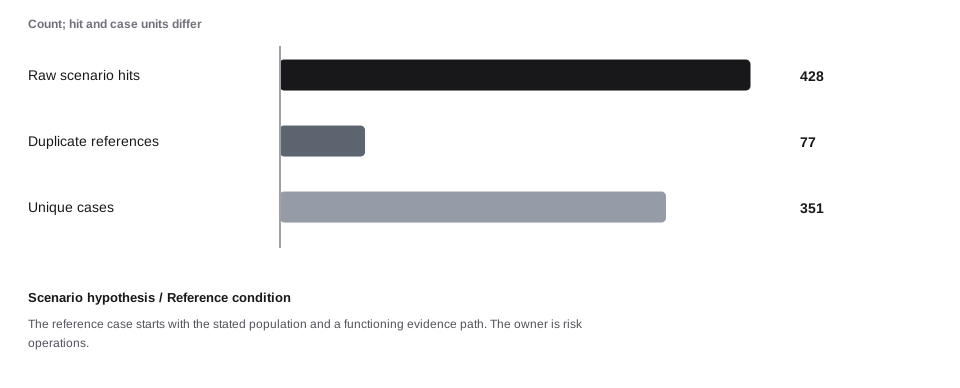
A concrete example. A monitoring rule should state the pattern it is intended to surface and the evidence that gives the pattern meaning. A threshold is only one implementation detail. The daily source population is 15,600 items, but 312 are outside the completed monitoring run. The included population creates 428 hits and 351 unique cases. With 80 cases already open and capacity for 350, the queue closes at 81. Coverage, duplicate work, and staffing are separate causes; reducing one number does not prove that the overall control improved.
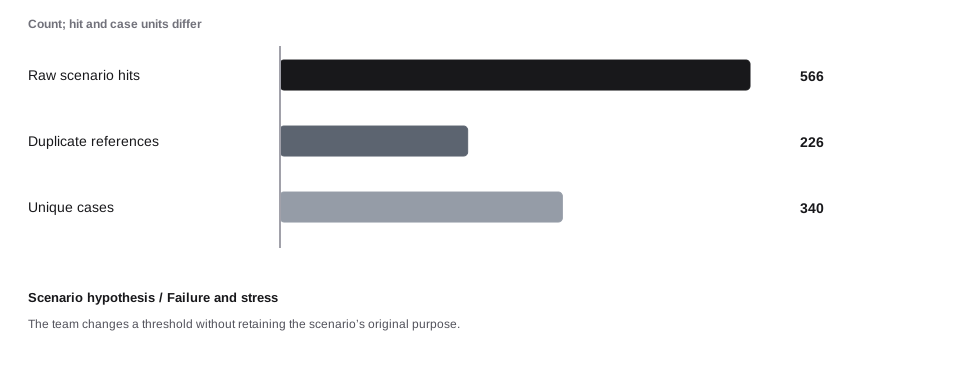
When the assumption fails. The team changes a threshold without retaining the scenario’s original purpose. Define the population, observation window, hypothesis, evidence, and intended case response. The following worked sequence shows the reference condition, a stress condition, and a response condition with explicit synthetic data. These are comparative assumptions, not measured causal effects.
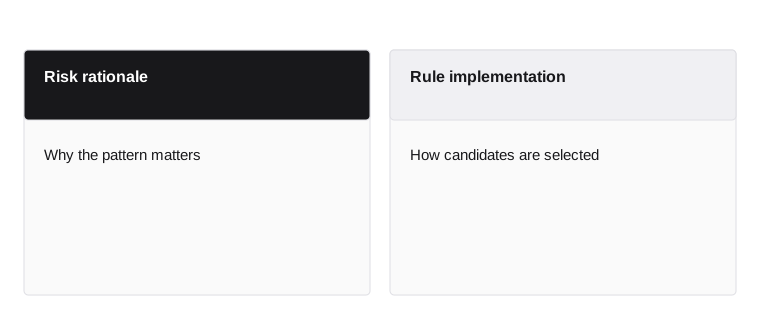
A monitoring rule should state the pattern it is intended to surface and the evidence that gives the pattern meaning. A threshold is only one implementation detail.
- Risk rationale
- Why the pattern matters
- Rule implementation
- How candidates are selected
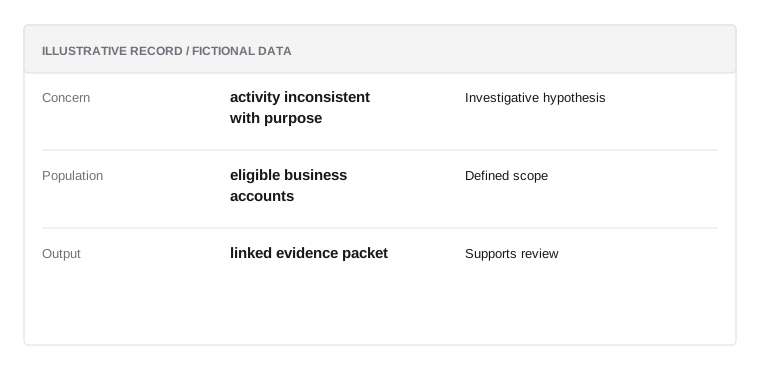
Scenario record
Illustrative data; not a real customer record or a prescribed policy.
- Concernactivity inconsistent with purpose
Investigative hypothesis
- Populationeligible business accounts
Defined scope
- Outputlinked evidence packet
Supports review
An unexplained threshold is hard to evaluate
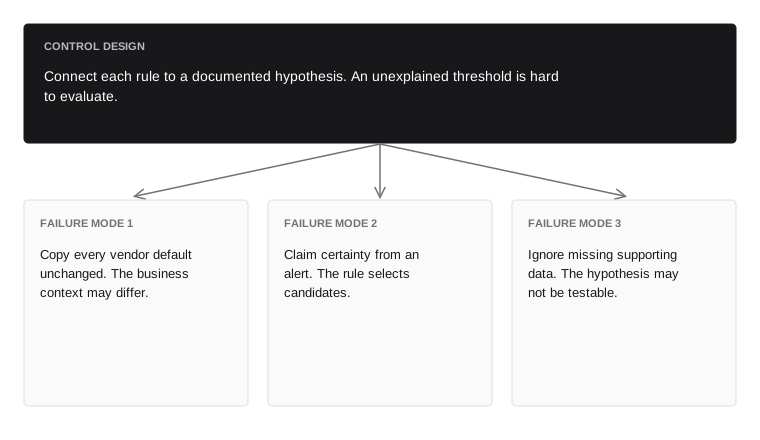
Connect each rule to a documented hypothesis. An unexplained threshold is hard to evaluate.
- Failure mode 1avoid
- Copy every vendor default unchanged. The business context may differ.
- Failure mode 2avoid
- Claim certainty from an alert. The rule selects candidates.
- Failure mode 3avoid
- Ignore missing supporting data. The hypothesis may not be testable.
Segment for meaningful comparison
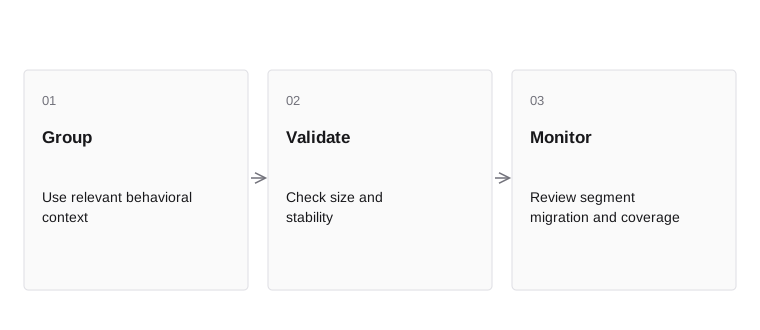
- GroupUse relevant behavioral context
- ValidateCheck size and stability
- MonitorReview segment migration and coverage
A peer group should make activity comparisons more meaningful. Product, business type, account age, and expected use can all matter. Too broad a segment creates noise; too narrow a segment produces unstable estimates and can hide unusual behavior.
Document the segmentation logic and minimum evidence needed. Evaluate whether a customer can move between segments and how that affects monitoring. Avoid creating a low-scrutiny segment merely because it generates fewer alerts. Compare coverage and outcomes, and investigate whether the segmentation removes the very pattern the program needs to see.
Inside the mechanism. Segmentation should improve comparability without hiding risk through overly narrow groups. Customers with different business models can have different expected flow patterns. State the segment assignment and update logic, and inspect small or unstable groups. A customer that changes activity may belong in a new comparison group, but moving the customer must not silently erase the evidence that triggered concern.
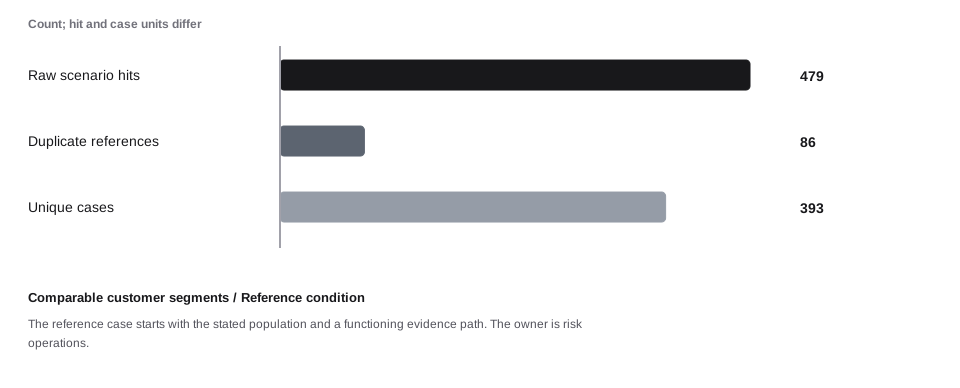
A concrete example. A cash-intensive retailer and a payroll provider can have different ordinary transaction patterns. A single peer comparison can obscure both legitimate variation and relevant changes. The daily source population is 13,200 items, but 264 are outside the completed monitoring run. The included population creates 479 hits and 393 unique cases. With 35 cases already open and capacity for 390, the queue closes at 38. Coverage, duplicate work, and staffing are separate causes; reducing one number does not prove that the overall control improved.
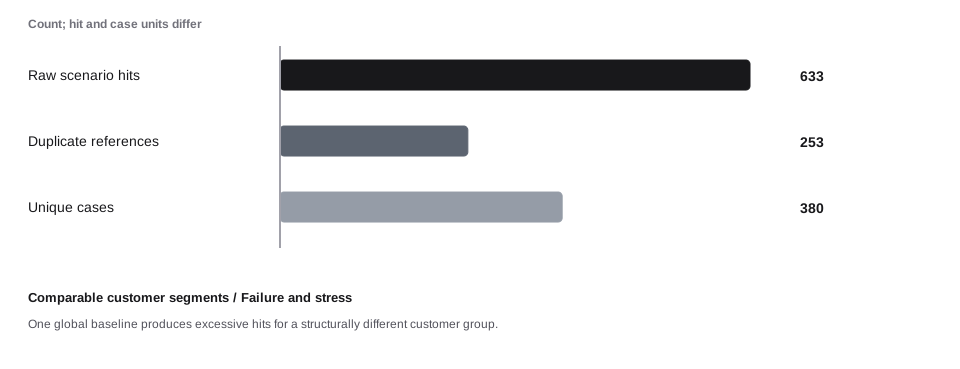
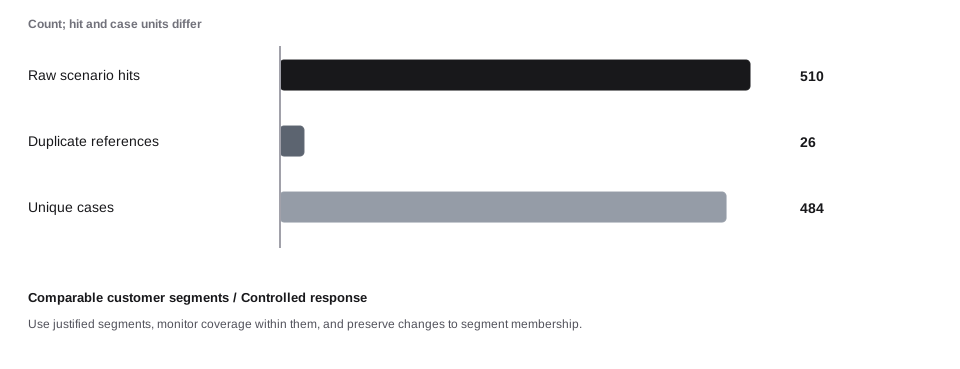
When the assumption fails. One global baseline produces excessive hits for a structurally different customer group. Use justified segments, monitor coverage within them, and preserve changes to segment membership. The following worked sequence shows the reference condition, a stress condition, and a response condition with explicit synthetic data. These are comparative assumptions, not measured causal effects.
A cash-intensive retailer and a payroll provider can have different ordinary transaction patterns. A single peer comparison can obscure both legitimate variation and relevant changes.
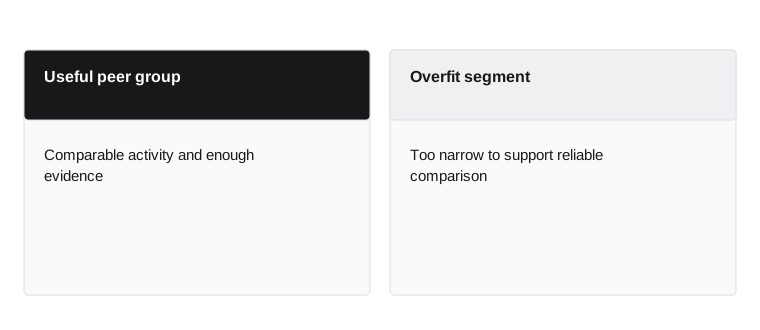
- Useful peer group
- Comparable activity and enough evidence
- Overfit segment
- Too narrow to support reliable comparison
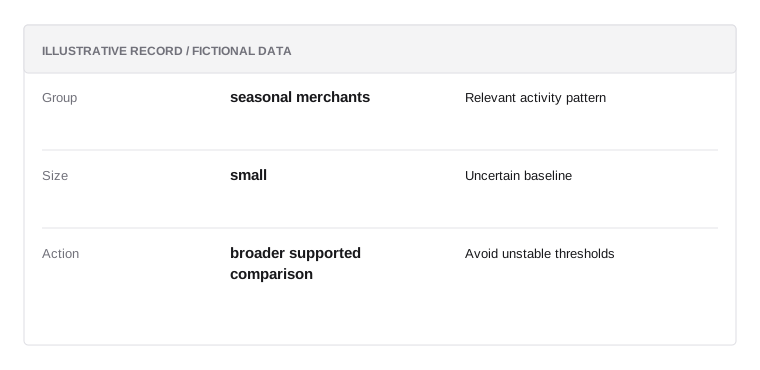
Segment design
Illustrative data; not a real customer record or a prescribed policy.
- Groupseasonal merchants
Relevant activity pattern
- Sizesmall
Uncertain baseline
- Actionbroader supported comparison
Avoid unstable thresholds
Small groups can produce unreliable baselines
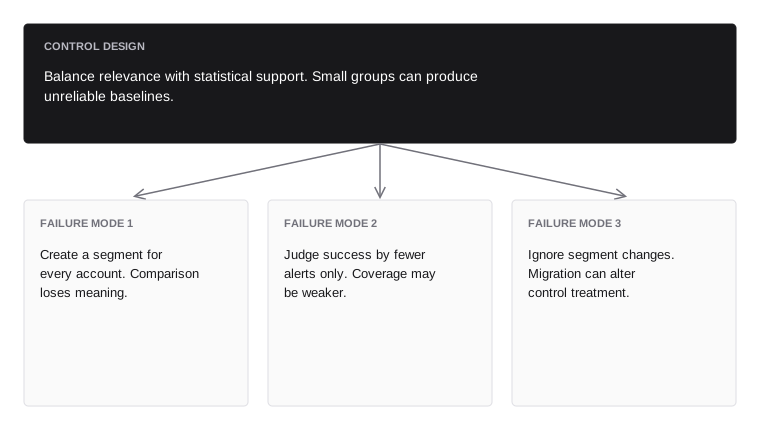
Balance relevance with statistical support. Small groups can produce unreliable baselines.
- Failure mode 1avoid
- Create a segment for every account. Comparison loses meaning.
- Failure mode 2avoid
- Judge success by fewer alerts only. Coverage may be weaker.
- Failure mode 3avoid
- Ignore segment changes. Migration can alter control treatment.
Deduplicate alerts without losing evidence
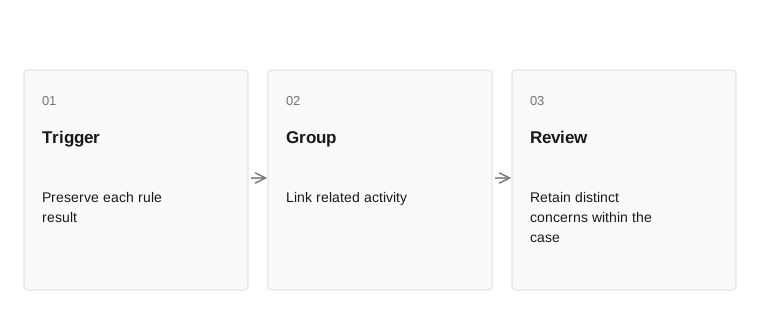
- TriggerPreserve each rule result
- GroupLink related activity
- ReviewRetain distinct concerns within the case
Several rules can detect the same underlying activity. Group related alerts into a coherent case when appropriate, but preserve the original triggers and evidence. Deduplication should reduce repeated work, not erase distinct concerns.
Use entity, event, time, and scenario relationships to define grouping. An account can have two unrelated issues in the same day. A single case may also involve several accounts. Make grouping reversible and visible. Analysts should know whether a new signal extends an existing investigation or requires a new line of inquiry.
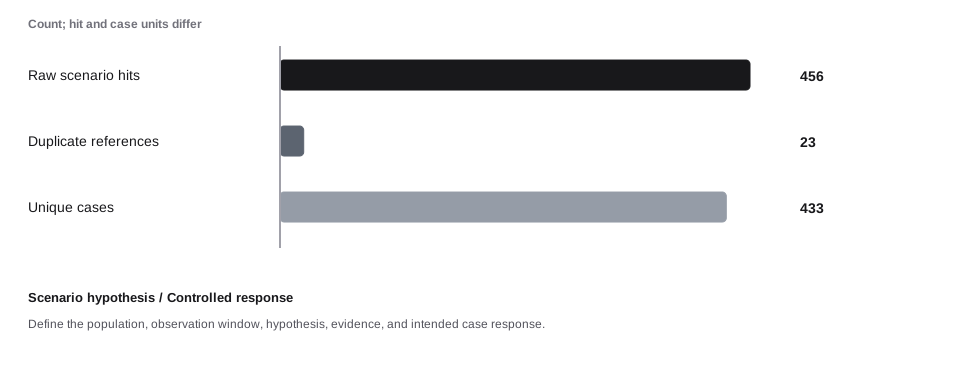
Inside the mechanism. Deduplicate repeated hits into an owned case while retaining all contributing events and rule reasons. Use a stated entity and time-window key, and define when new evidence reopens or extends the case. Excessive merging can hide distinct concerns; insufficient merging overwhelms investigators. Measure raw hits, unique cases, reopened cases, and the underlying source population separately.
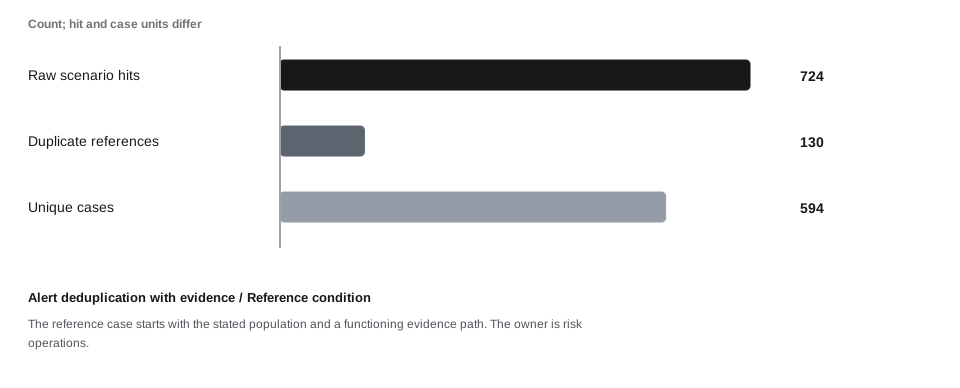
A concrete example. Several scenarios can surface the same event or related activity. A case should preserve every material reason without requiring reviewers to repeat the same work. The daily source population is 8,900 items, but 178 are outside the completed monitoring run. The included population creates 724 hits and 594 unique cases. With 95 cases already open and capacity for 460, the queue closes at 229. Coverage, duplicate work, and staffing are separate causes; reducing one number does not prove that the overall control improved.
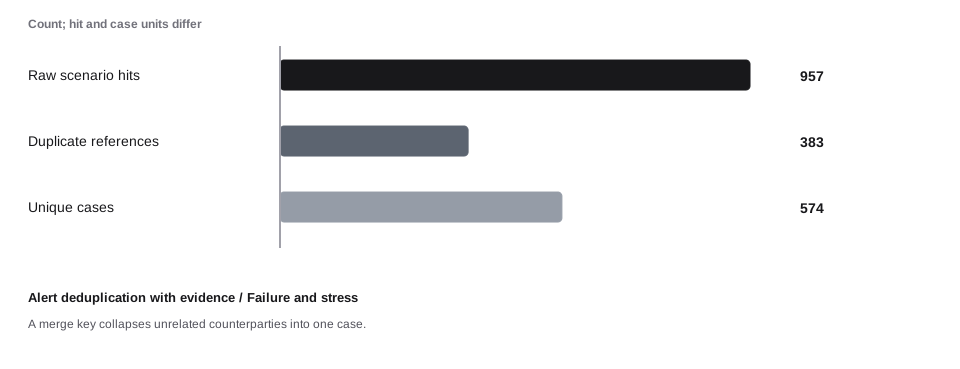
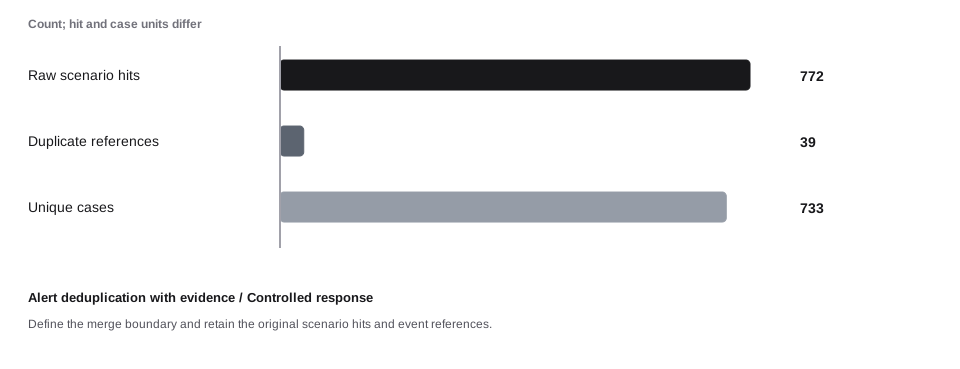
When the assumption fails. A merge key collapses unrelated counterparties into one case. Define the merge boundary and retain the original scenario hits and event references. The following worked sequence shows the reference condition, a stress condition, and a response condition with explicit synthetic data. These are comparative assumptions, not measured causal effects.
Several scenarios can surface the same event or related activity. A case should preserve every material reason without requiring reviewers to repeat the same work.
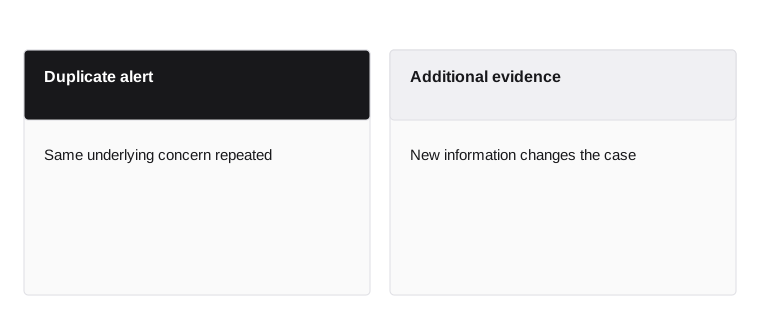
- Duplicate alert
- Same underlying concern repeated
- Additional evidence
- New information changes the case
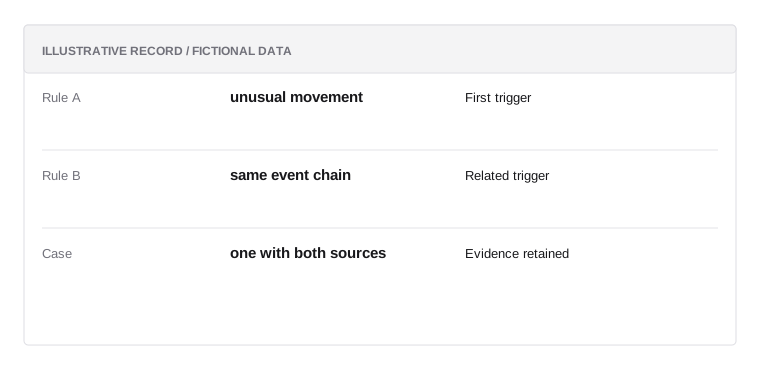
Alert grouping
Illustrative data; not a real customer record or a prescribed policy.
- Rule Aunusual movement
First trigger
- Rule Bsame event chain
Related trigger
- Caseone with both sources
Evidence retained
Efficiency should not remove evidence
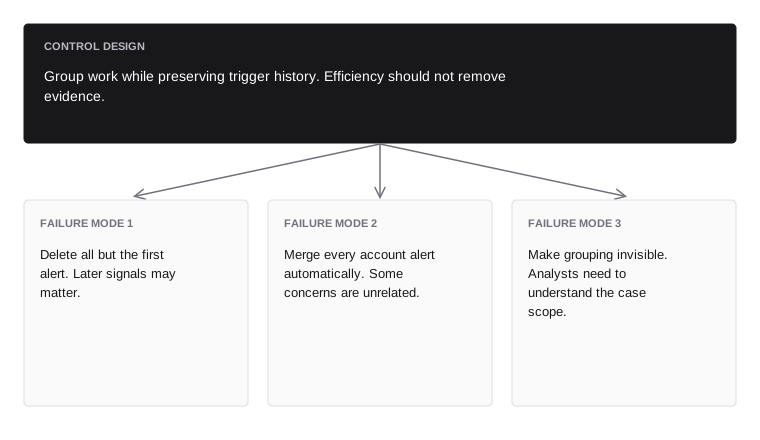
Group work while preserving trigger history. Efficiency should not remove evidence.
- Failure mode 1avoid
- Delete all but the first alert. Later signals may matter.
- Failure mode 2avoid
- Merge every account alert automatically. Some concerns are unrelated.
- Failure mode 3avoid
- Make grouping invisible. Analysts need to understand the case scope.
Tune with outcomes and coverage
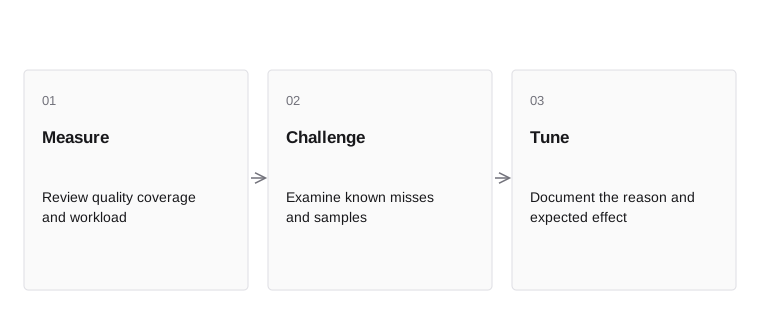
- MeasureReview quality coverage and workload
- ChallengeExamine known misses and samples
- TuneDocument the reason and expected effect
Alert volume is a workload measure, not a direct measure of effectiveness. Review yield, investigation quality, known missed cases, coverage, and customer impact. A high closure rate can mean good triage or superficial review.
Use labeled examples carefully because prior policies shape what was investigated. Sample below-threshold and otherwise unalerted activity where appropriate to assess blind spots. Document tuning changes and their expected effects. Do not lower sensitivity solely to fit today’s staffing. If capacity is inadequate, make the risk and resource decision explicit.
Low alert yield does not automatically mean a control is useless, and high yield does not prove complete coverage. A narrow rule can produce convincing cases while missing a large unobserved population. Review quality, known-event coverage, data completeness, and scenario purpose alongside case outcomes. When a rule is retired or reduced, record which other control covers the exposure or which residual risk is accepted by the appropriate owner. Fewer alerts is a workload result; it becomes a risk result only with evidence about what changed.
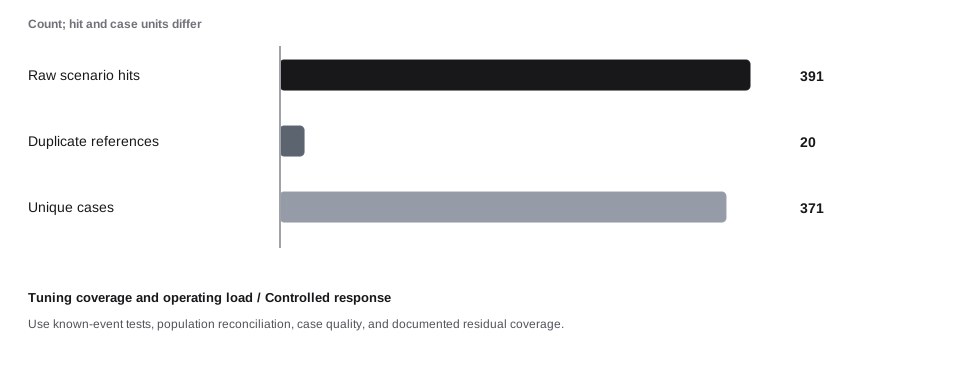
Inside the mechanism. A reduction in alerts can come from better precision, narrower coverage, missing data, or increased suppression. Evaluate those possibilities independently. Known test scenarios can verify execution and delivery, but they do not estimate every real-world missed event. Investigator dispositions also reflect selection and available evidence. Tuning should retain coverage tests and document the effect on the eligible population.
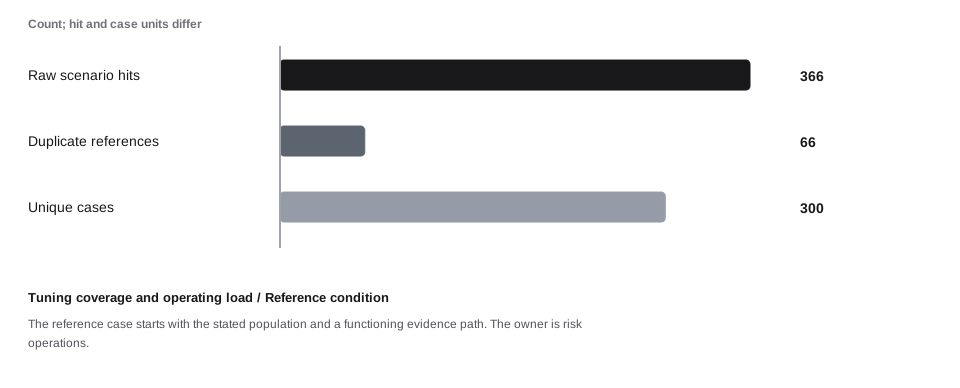
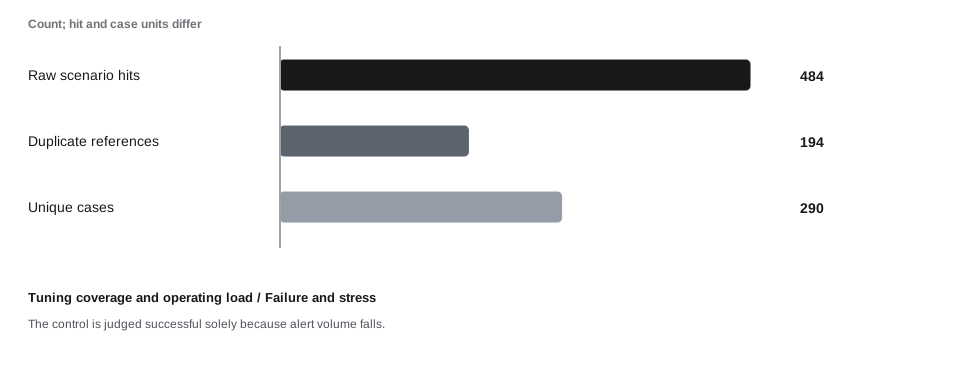
A concrete example. A smaller queue can reflect improved precision or missing data. Outcome yield alone cannot reveal all the activity a scenario failed to see. The daily source population is 17,800 items, but 356 are outside the completed monitoring run. The included population creates 366 hits and 300 unique cases. With 50 cases already open and capacity for 300, the queue closes at 50. Coverage, duplicate work, and staffing are separate causes; reducing one number does not prove that the overall control improved.
When the assumption fails. The control is judged successful solely because alert volume falls. Use known-event tests, population reconciliation, case quality, and documented residual coverage. The following worked sequence shows the reference condition, a stress condition, and a response condition with explicit synthetic data. These are comparative assumptions, not measured causal effects.
A smaller queue can reflect improved precision or missing data. Outcome yield alone cannot reveal all the activity a scenario failed to see.
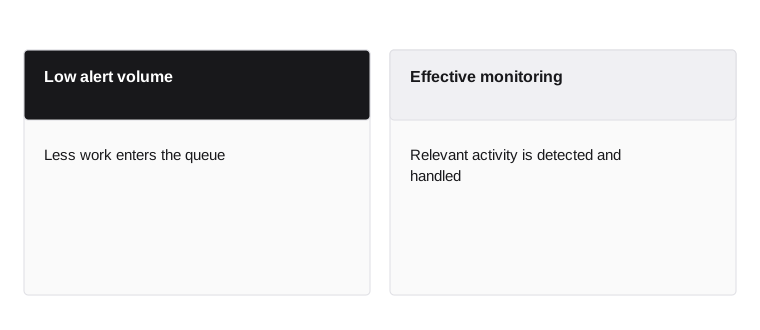
- Low alert volume
- Less work enters the queue
- Effective monitoring
- Relevant activity is detected and handled
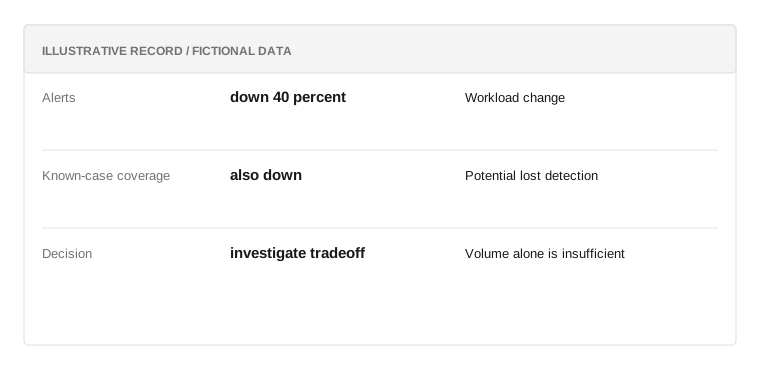
Tuning review
Illustrative data; not a real customer record or a prescribed policy.
- Alertsdown 40 percent
Workload change
- Known-case coveragealso down
Potential lost detection
- Decisioninvestigate tradeoff
Volume alone is insufficient
Fewer alerts can mean worse coverage
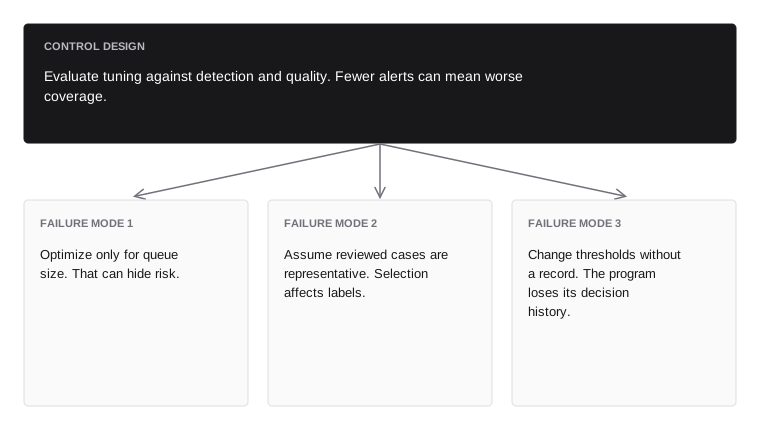
Evaluate tuning against detection and quality. Fewer alerts can mean worse coverage.
- Failure mode 1avoid
- Optimize only for queue size. That can hide risk.
- Failure mode 2avoid
- Assume reviewed cases are representative. Selection affects labels.
- Failure mode 3avoid
- Change thresholds without a record. The program loses its decision history.
Test end-to-end delivery
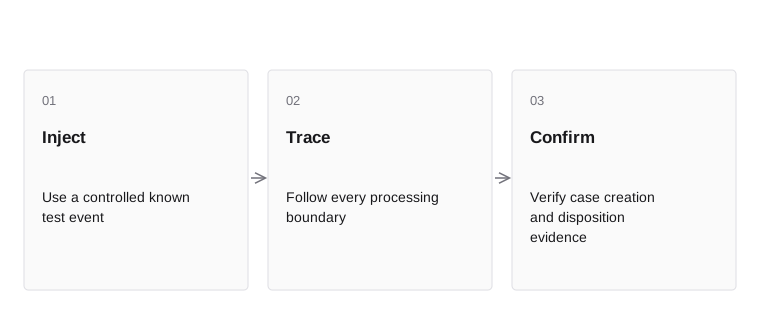
- InjectUse a controlled known test event
- TraceFollow every processing boundary
- ConfirmVerify case creation and disposition evidence
A scenario can calculate correctly and still fail if alerts never reach reviewers. Test ingestion, feature construction, rule execution, queue creation, assignment, and disposition. Use controlled synthetic events that represent the intended patterns without exposing real customer information.
Track expected counts at each boundary and reconcile them. A queue outage should create a visible operational incident with preserved events for replay. Replaying must not duplicate cases or lose the original event times. The monitoring system needs the same reliability discipline as a money-moving service.
Inside the mechanism. End-to-end testing follows a known eligible event through ingestion, normalization, rule execution, queue creation, reviewer access, and closure evidence. Check both counts and stable identifiers. A rule engine can produce the right alert while a failed handoff prevents any investigation. Keep dead-letter and rejected populations owned and reconciled; successful processing metrics must not exclude them without explanation.
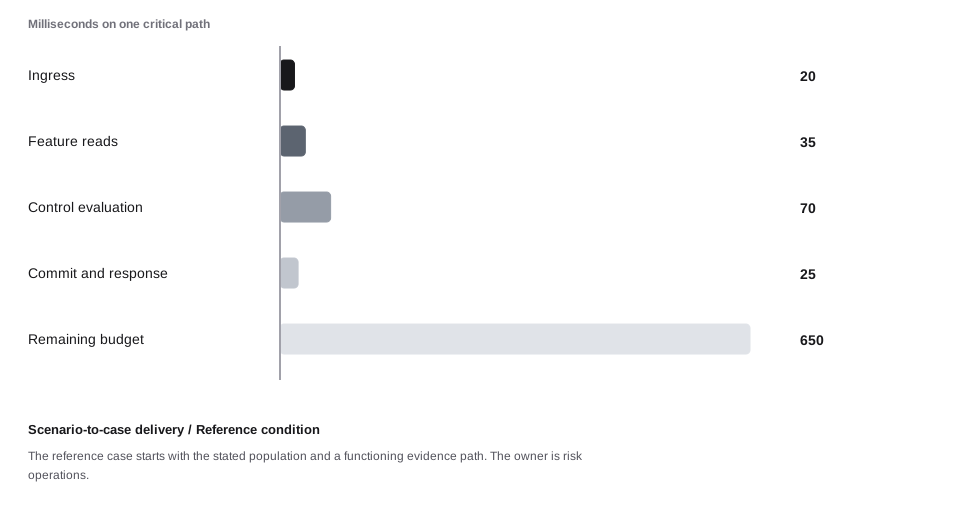
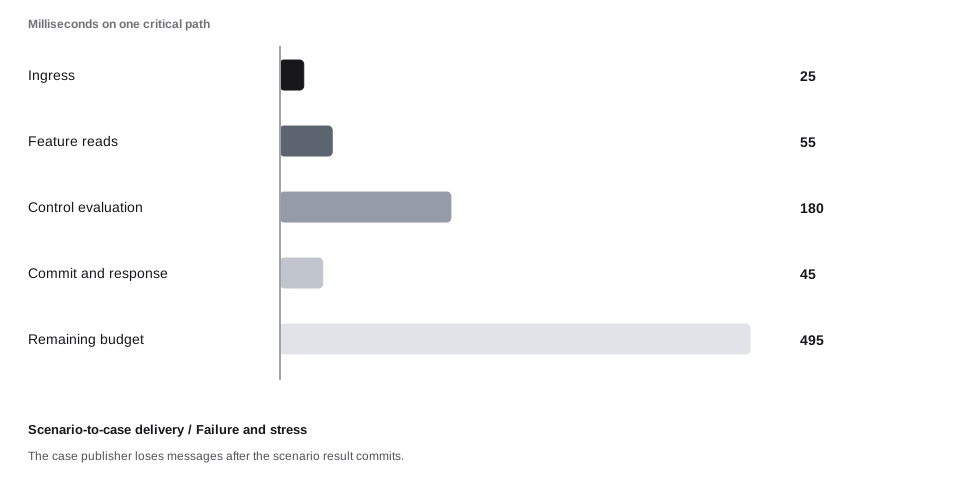
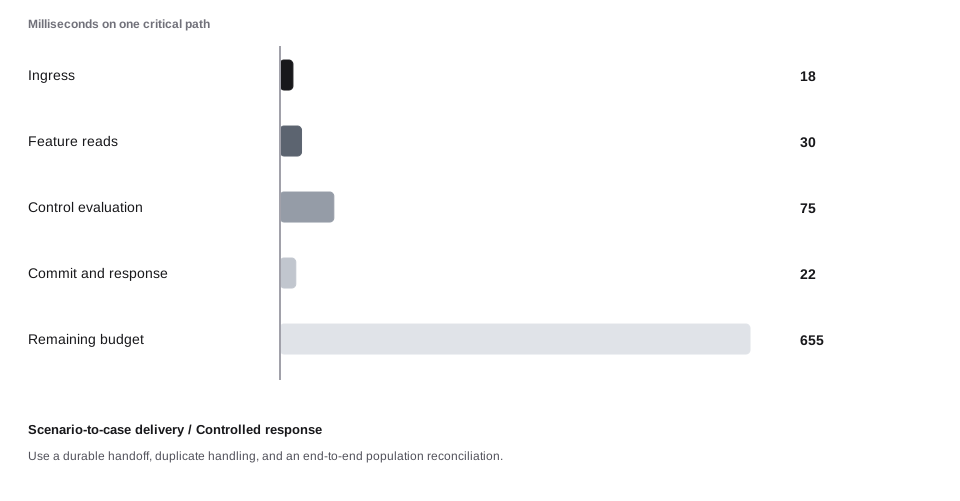
A concrete example. A batch job can finish while its messages fail to create usable cases. The control is complete only when the intended reviewer can access the evidence and act. 175 intended requests generate 184 processing attempts under this retry assumption. Capacity is 210 attempts per interval, and the critical path consumes 150 ms of a 800 ms budget. The request-based SLO view observes 100 bad requests against an illustrative allowance of 100. These measurements must be connected to the financial effect and control evidence before declaring recovery.
When the assumption fails. The case publisher loses messages after the scenario result commits. Use a durable handoff, duplicate handling, and an end-to-end population reconciliation. The following worked sequence shows the reference condition, a stress condition, and a response condition with explicit synthetic data. These are comparative assumptions, not measured causal effects.
A batch job can finish while its messages fail to create usable cases. The control is complete only when the intended reviewer can access the evidence and act.
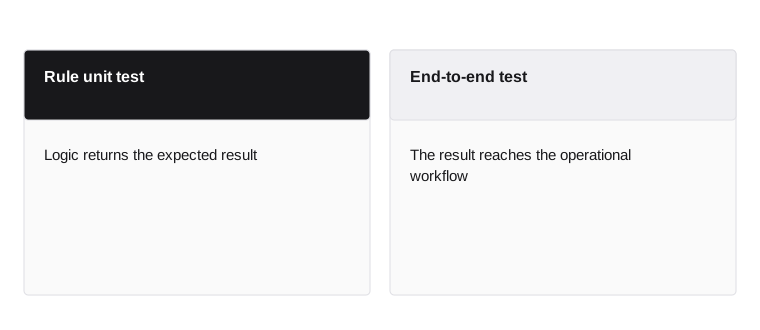
- Rule unit test
- Logic returns the expected result
- End-to-end test
- The result reaches the operational workflow
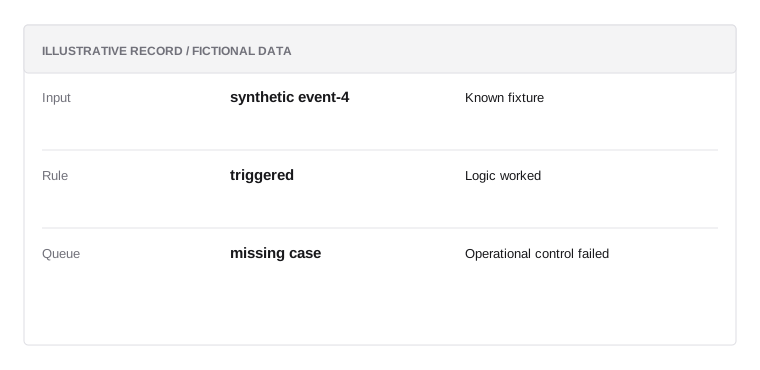
Pipeline test
Illustrative data; not a real customer record or a prescribed policy.
- Inputsynthetic event-4
Known fixture
- Ruletriggered
Logic worked
- Queuemissing case
Operational control failed
Detection is incomplete if no one receives it
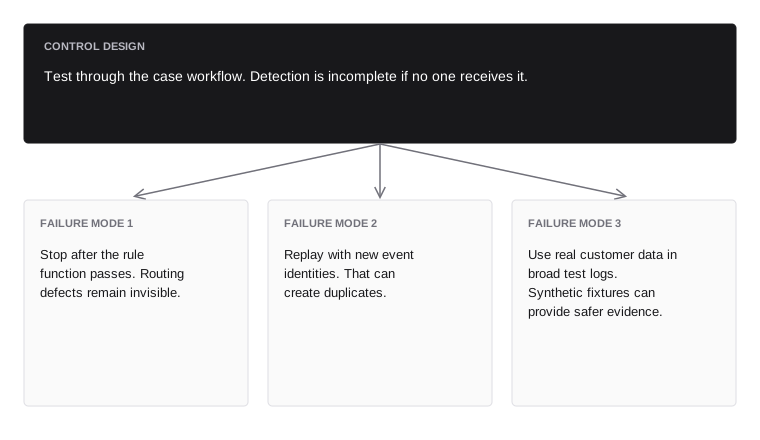
Test through the case workflow. Detection is incomplete if no one receives it.
- Failure mode 1avoid
- Stop after the rule function passes. Routing defects remain invisible.
- Failure mode 2avoid
- Replay with new event identities. That can create duplicates.
- Failure mode 3avoid
- Use real customer data in broad test logs. Synthetic fixtures can provide safer evidence.
Chapter connections
This chapter builds on Entity resolution and financial networks. Continue with Investigations, reporting, and confidentiality to follow the next part of the system. Use the glossary for terminology and risk mathematics for formulas and worked calculations.