
Reproducible graph determination
Make the calculation auditable
Direct holdings in the ownership graph
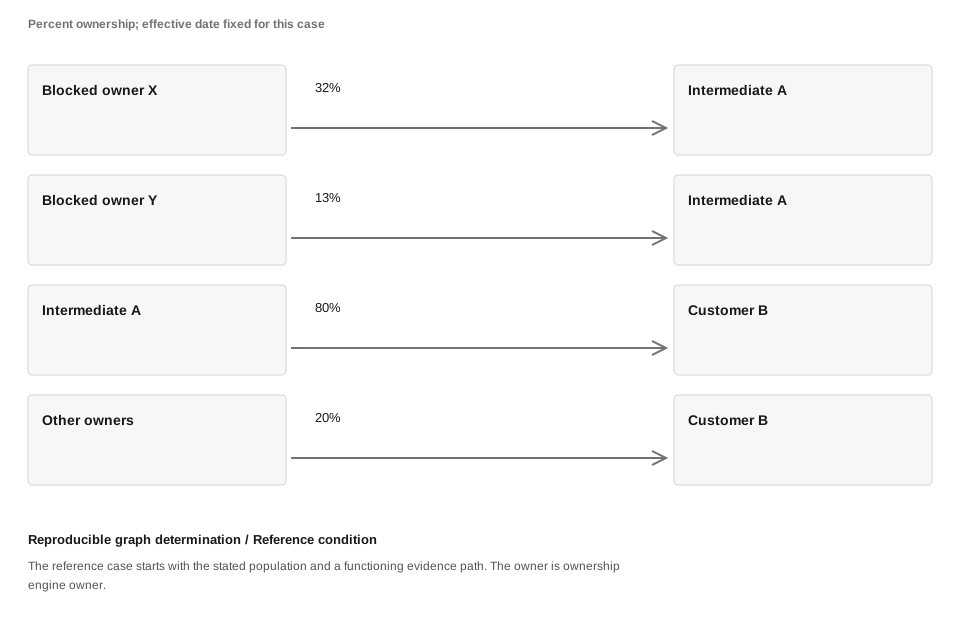
The directed edges are documented ownership interests in this synthetic U.S. OFAC example. Owners X and Y are assumed blocked. The graph contains no cross-holdings, trusts, nominee arrangements, or conflicting share classes; those would require additional analysis.
Figure data and text version
| Owner | Entity | Stake |
|---|---|---|
| Blocked owner X | Intermediate A | 32% |
| Blocked owner Y | Intermediate A | 13% |
| Intermediate A | Customer B | 80% |
| Other owners | Customer B | 20% |
The reviewer needs to reconstruct which edges, dates, identities, and rule version produced a conclusion. Numeric output alone cannot explain an ownership assessment.
The reference case starts with the stated population and a functioning evidence path. The owner is ownership engine owner.
All amounts, rates, capacity limits, and outcomes in this case are synthetic. The three conditions are separate assumptions for comparison. A better result in the response condition is not measured proof that the proposed control causes that improvement. The figures expose the calculation and its limits; a real deployment needs its own evidence.
Read the result
Assumed blocked owners hold 32% and 13% of Intermediate A. Their aggregate is 45%. A then owns 80% of Customer B. The worked determination is: Not shown blocked by this ownership calculation alone. The simple economic product of 36.00% is retained only to show why multiplication and rule-specific status propagation are different operations.
Model inputs and calculated values
Inputs below are the case-specific values. Each figure states the condition-specific assumptions and units used in its calculation. Calculated values are rounded for display.
| Input | Value |
|---|---|
| stakeA | 32 |
| stakeB | 13 |
| childStake | 80 |
| Calculated value | Result |
|---|---|
| stakeA | 32 |
| stakeB | 13 |
| aggregate | 45 |
| childStake | 80 |
| known | true |
| blockedA | false |
| blockedB | false |
| naiveProduct | 36 |
Aggregate the relevant direct interests
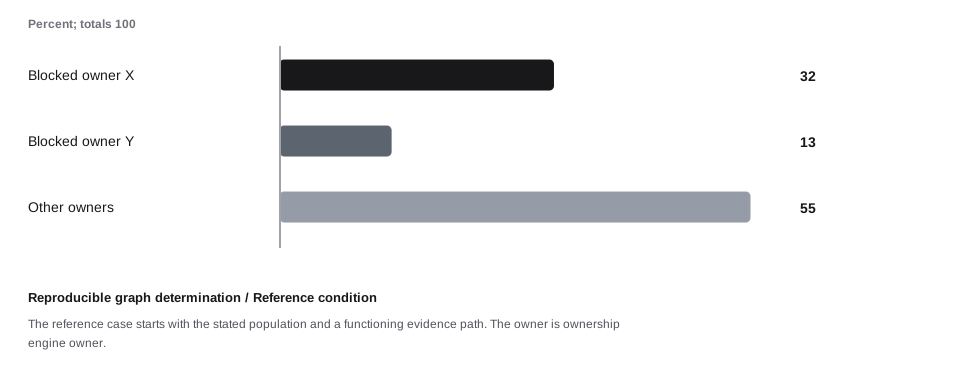
Assumed blocked owners X and Y hold 32% and 13% of Intermediate A, for 45% in aggregate. Other interests total 55%. The chart counts each direct holding once and uses one common ownership basis.
Figure data and text version
| Holding | Percent |
|---|---|
| Blocked owner X | 32 |
| Blocked owner Y | 13 |
| Other owners | 55 |
An adjacency matrix preserves edge meaning
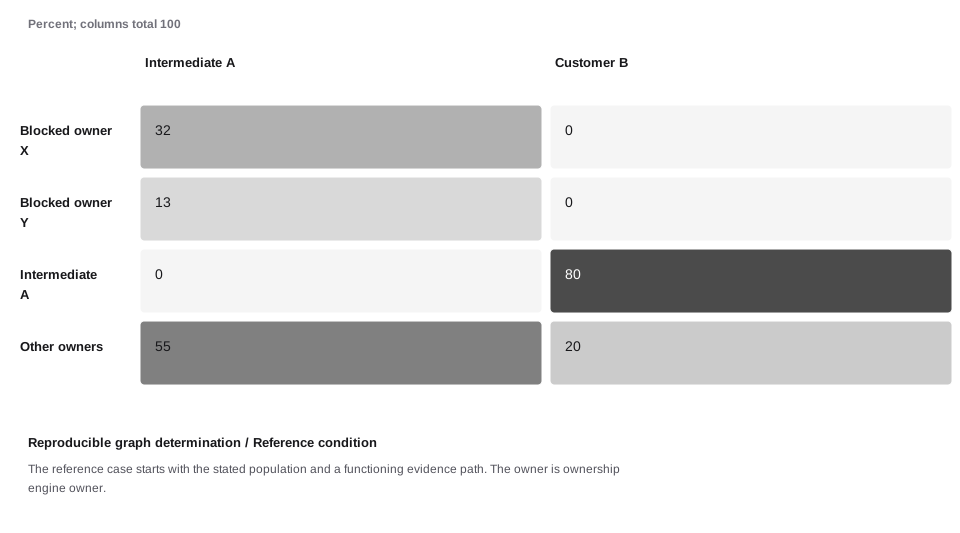
Rows identify owners and columns identify entities. Each nonzero cell is one direct interest from the graph. A matrix can help detect duplicated edges and inconsistent totals, but it cannot resolve a missing or unreliable ownership fact.
Figure data and text version
| Owner | Intermediate A | Customer B |
|---|---|---|
| Blocked owner X | 32 | 0 |
| Blocked owner Y | 13 | 0 |
| Intermediate A | 0 | 80 |
| Other owners | 55 | 20 |
Status propagates through qualifying entities
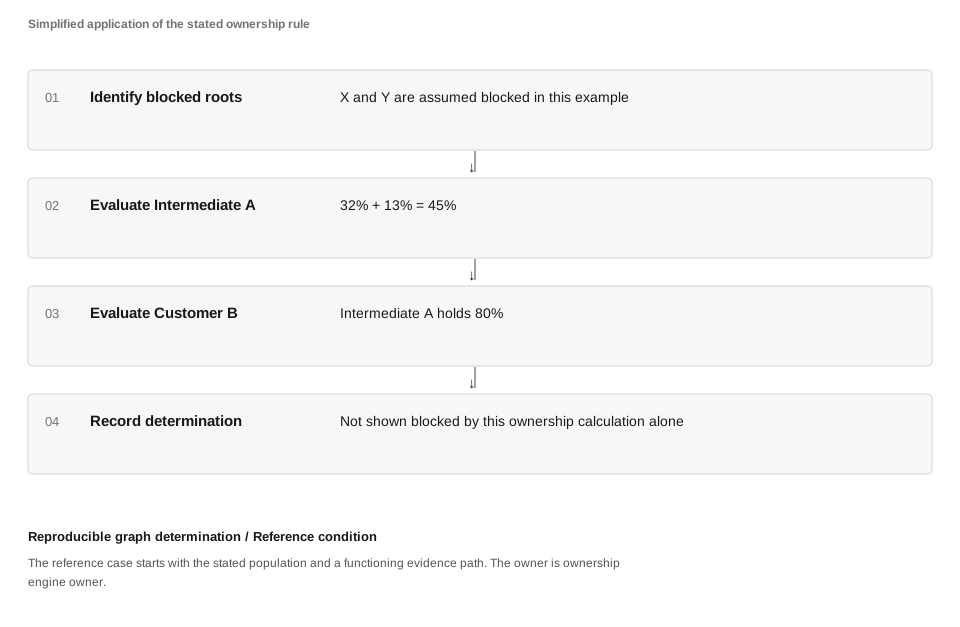
Intermediate A has 45% aggregate ownership by assumed blocked persons. In the known-data calculation, its status is not established as blocked by this test. Its 80% holding in Customer B is then evaluated in that capacity. Incomplete evidence prevents a final conclusion.
Figure data and text version
| Step | Result |
|---|---|
| Identify blocked roots | X and Y are assumed blocked in this example |
| Evaluate Intermediate A | 32% + 13% = 45% |
| Evaluate Customer B | Intermediate A holds 80% |
| Record determination | Not shown blocked by this ownership calculation alone |
Economic multiplication is a different calculation
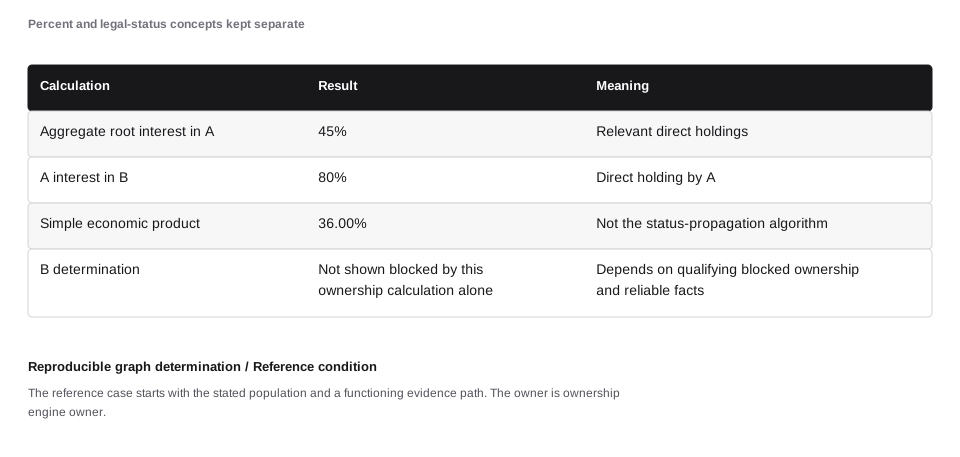
A simple product gives 36.00% economic look-through interest. That number does not replace OFAC status propagation through an entity that is itself blocked under the 50 Percent Rule. The rule-specific analysis must retain both the graph and the intermediate determinations.
Figure data and text version
| Calculation | Result | Meaning |
|---|---|---|
| Aggregate root interest in A | 45% | Relevant direct holdings |
| A interest in B | 80% | Direct holding by A |
| Simple economic product | 36.00% | Not the status-propagation algorithm |
| B determination | Not shown blocked by this ownership calculation alone | Depends on qualifying blocked ownership and reliable facts |
The ownership threshold is a discontinuity
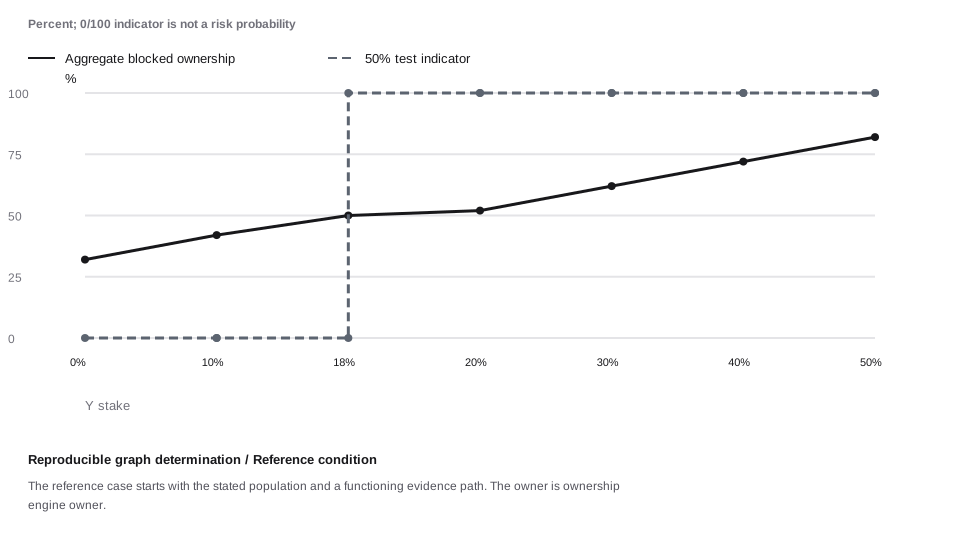
The plot varies owner Y’s stake while holding X at 32%. The status indicator changes when their aggregate reaches 50%. An indicator of 100 means the stated test is met; it is not a probability or a severity score. Other restrictions can still apply below that point. Horizontal positions are the labeled observations or scenarios; equal spacing does not imply equal numerical increments.
Figure data and text version
| Y stake | Aggregate % | Test indicator |
|---|---|---|
| 0% | 32 | 0 |
| 10% | 42 | 0 |
| 18% | 50 | 100 |
| 20% | 52 | 100 |
| 30% | 62 | 100 |
| 40% | 72 | 100 |
| 50% | 82 | 100 |
Every edge needs dated evidence
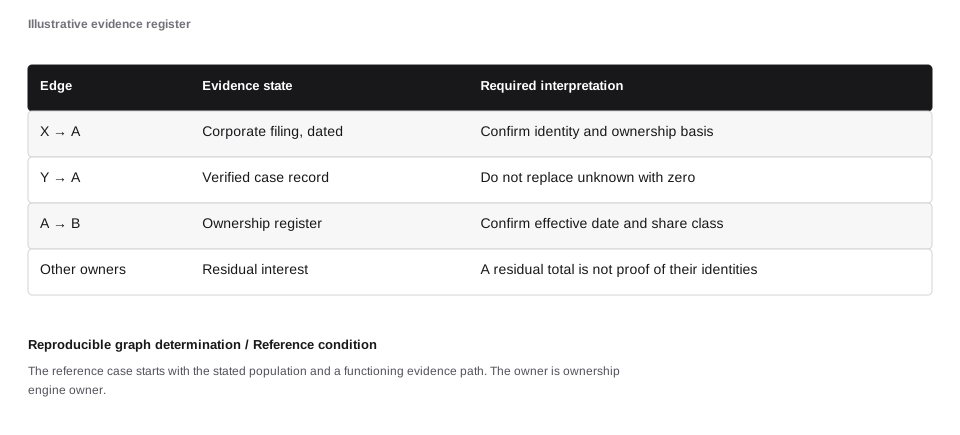
An ownership result is only as defensible as its inputs. Keep the document, effective date, retrieval date, ownership basis, and reviewer attached to the edge. A recent download of an old filing does not make the underlying ownership current.
Figure data and text version
| Edge | Evidence state | Required interpretation |
|---|---|---|
| X → A | Corporate filing, dated | Confirm identity and ownership basis |
| Y → A | Verified case record | Do not replace unknown with zero |
| A → B | Ownership register | Confirm effective date and share class |
| Other owners | Residual interest | A residual total is not proof of their identities |
A repeated record is not a second holding
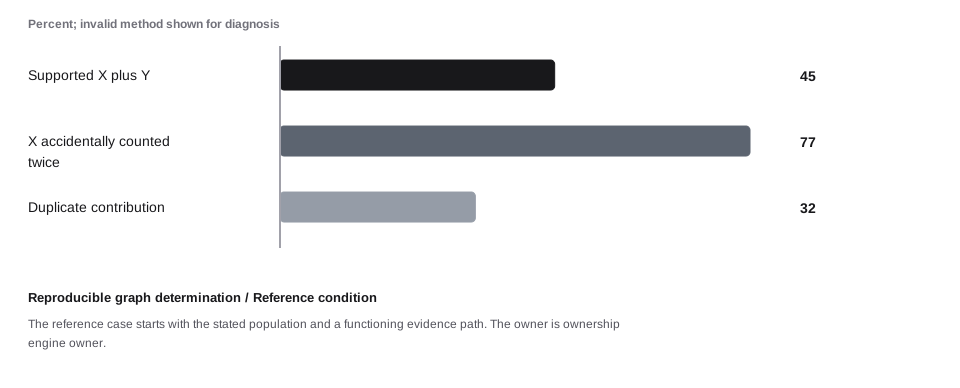
If X’s 32% edge appears twice in a data feed, naive addition produces 77% instead of the supported 45%. Deduplicate by the underlying ownership fact and effective interval, not merely by a convenient text label.
Figure data and text version
| Aggregation method | Percent |
|---|---|
| Supported X plus Y | 45 |
| X accidentally counted twice | 77 |
| Duplicate contribution | 32 |
Control and ownership are separate relationships
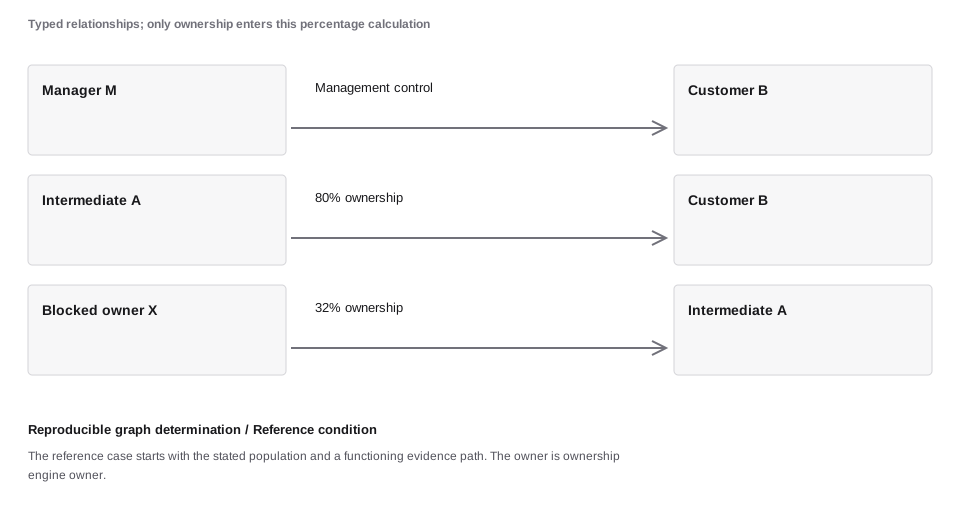
The management edge is deliberately different from an ownership edge. Control by a blocked person can raise separate concerns, but it should not be silently converted into a percentage within this ownership formula. The appropriate legal review considers the actual program and facts.
Figure data and text version
| From | To | Relationship |
|---|---|---|
| Manager M | Customer B | Management control |
| Intermediate A | Customer B | 80% ownership |
| Blocked owner X | Intermediate A | 32% ownership |
Unknown is a distinct evidence state
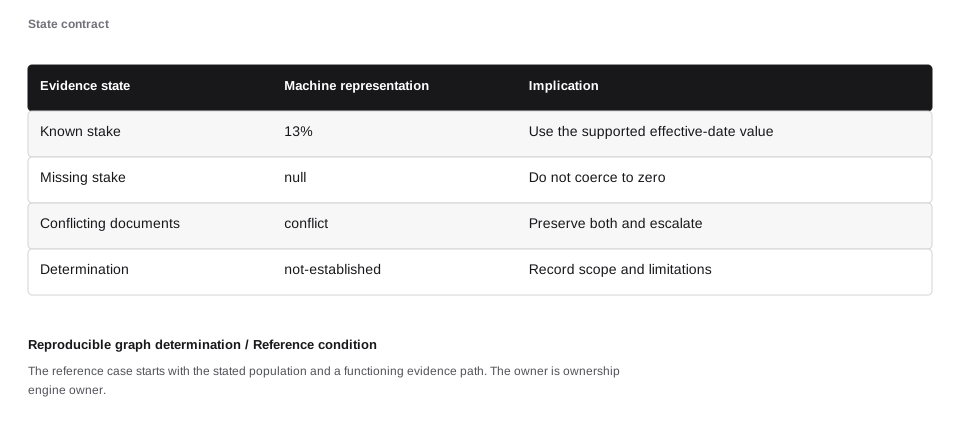
The current determination is: Not shown blocked by this ownership calculation alone. A screening engine should be able to return unresolved evidence without forcing a false clear or a false exact percentage. Operational handling must follow the institution’s approved procedure and applicable obligations.
Figure data and text version
| Evidence state | Machine representation | Implication |
|---|---|---|
| Known stake | 13% | Use the supported effective-date value |
| Missing stake | null | Do not coerce to zero |
| Conflicting documents | conflict | Preserve both and escalate |
| Determination | not-established | Record scope and limitations |
A change in facts starts another assessment
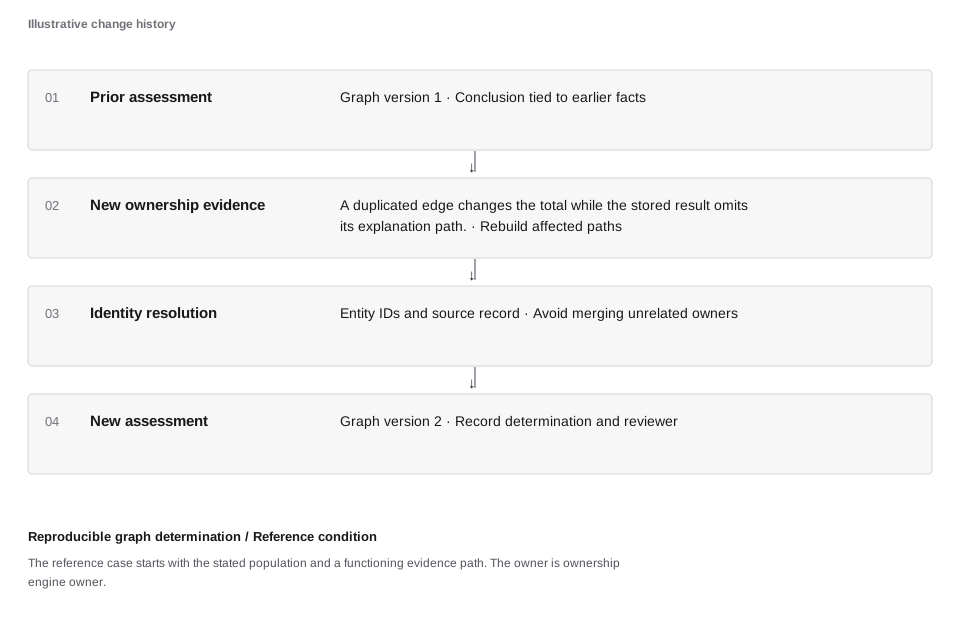
A prior ownership review is a dated conclusion. New filings, a transfer of shares, a list update, or a correction to entity identity can change the relevant facts. The event log should preserve the old conclusion while recording the basis for the new one.
Figure data and text version
| Event | Record | Effect |
|---|---|---|
| Prior assessment | Graph version 1 | Conclusion tied to earlier facts |
| New ownership evidence | A duplicated edge changes the total while the stored result omits its explanation path. | Rebuild affected paths |
| Identity resolution | Entity IDs and source record | Avoid merging unrelated owners |
| New assessment | Graph version 2 | Record determination and reviewer |
A reproducible determination record
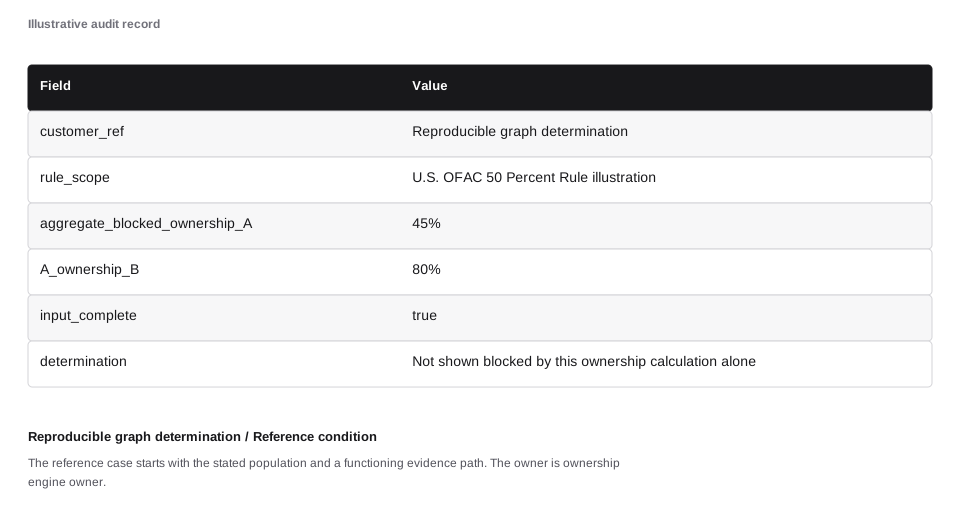
The final record contains enough information to explain the result without relying on the diagram alone. A complete implementation also needs validation for cycles, over-allocated shares, duplicate legal interests, and structures outside the approved method.
Figure data and text version
| Field | Value |
|---|---|
| customer_ref | Reproducible graph determination |
| rule_scope | U.S. OFAC 50 Percent Rule illustration |
| aggregate_blocked_ownership_A | 45% |
| A_ownership_B | 80% |
| input_complete | true |
| determination | Not shown blocked by this ownership calculation alone |
Connect the result to the system
Validate the graph and retain the supporting edge set and each intermediate result.
Check the population, evidence, permitted action, and actual effect together. A balanced calculation can still use the wrong population; a successful response can still leave an unknown financial outcome. The case’s numerical result applies only to its stated assumptions.
Sources and further reading
The chapter sources support the concepts and scope. They do not prescribe the synthetic model rates.