
Instant-transfer status path
Fast rails change control timing
Dependencies form a critical path
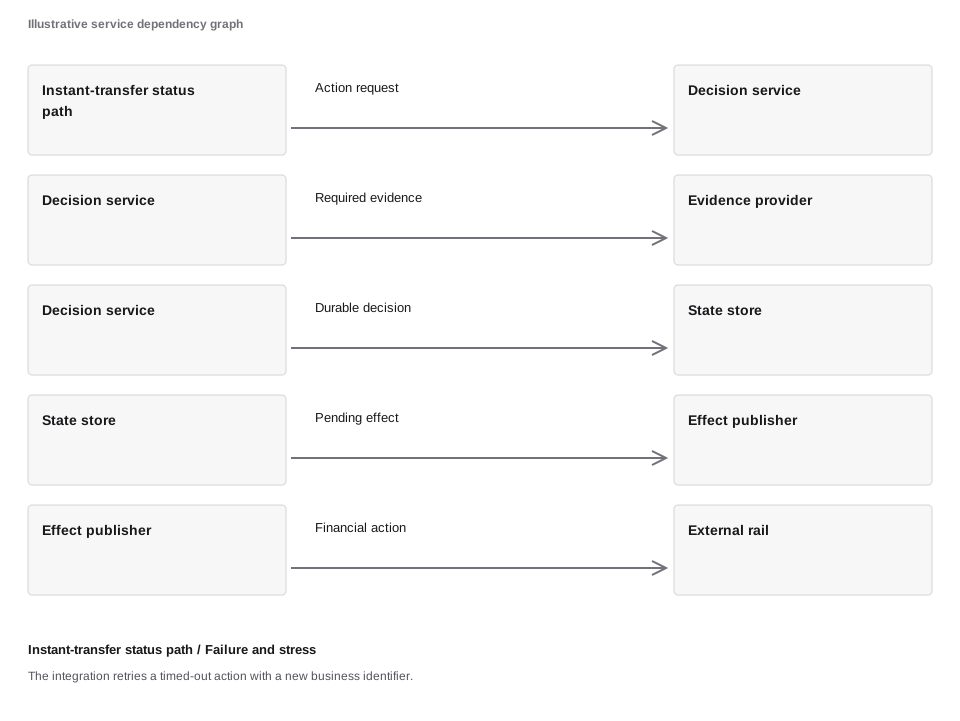
The case examines fast rails change control timing. Each edge is a required handoff in this illustrative path. A service can respond quickly while a downstream effect remains incomplete, so health needs both technical and business evidence.
Figure data and text version
| From | To | Handoff |
|---|---|---|
| Instant-transfer status path | Decision service | Action request |
| Decision service | Evidence provider | Required evidence |
| Decision service | State store | Durable decision |
| State store | Effect publisher | Pending effect |
| Effect publisher | External rail | Financial action |
A fast transfer can leave the sender while the platform waits for an acknowledgement. A timeout says the reply is missing, not that the financial action failed.
The integration retries a timed-out action with a new business identifier.
All amounts, rates, capacity limits, and outcomes in this case are synthetic. The three conditions are separate assumptions for comparison. A better result in the response condition is not measured proof that the proposed control causes that improvement. The figures expose the calculation and its limits; a real deployment needs its own evidence.
Read the result
210 intended requests generate 378 processing attempts under this retry assumption. Capacity is 135 attempts per interval, and the critical path consumes 305 ms of a 180 ms budget. The request-based SLO view observes 3000 bad requests against an illustrative allowance of 100. These measurements must be connected to the financial effect and control evidence before declaring recovery.
Model inputs and calculated values
Inputs below are the case-specific values. Each figure states the condition-specific assumptions and units used in its calculation. Calculated values are rounded for display.
| Input | Value |
|---|---|
| arrivals | 210 |
| capacity | 245 |
| budgetMs | 180 |
| Calculated value | Result |
|---|---|
| arrivals | 210 |
| attempts | 378 |
| capacity | 135 |
| latency | 305 |
| budget | 180 |
| remaining | -125 |
| window | 100,000 |
| bad | 3,000 |
| allowed | 100 |
Allocate the latency budget explicitly
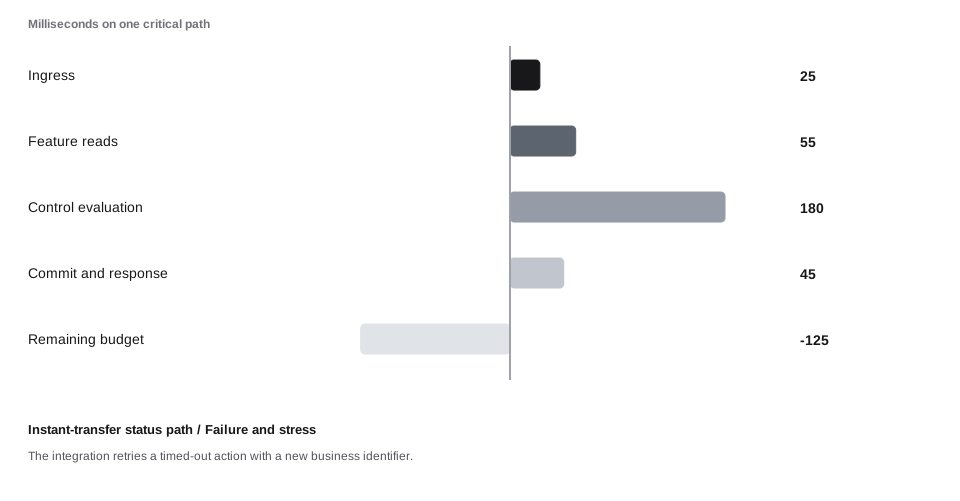
The four stages total 305 ms against a 180 ms budget, leaving -125 ms. Negative remaining time means this modeled path exceeds the target before adding any unmodeled overhead. The values are fixed teaching observations, not a latency guarantee.
Figure data and text version
| Stage | Milliseconds |
|---|---|
| Ingress | 25 |
| Feature reads | 55 |
| Control evaluation | 180 |
| Commit and response | 45 |
| Remaining budget | -125 |
A slow minority changes the tail
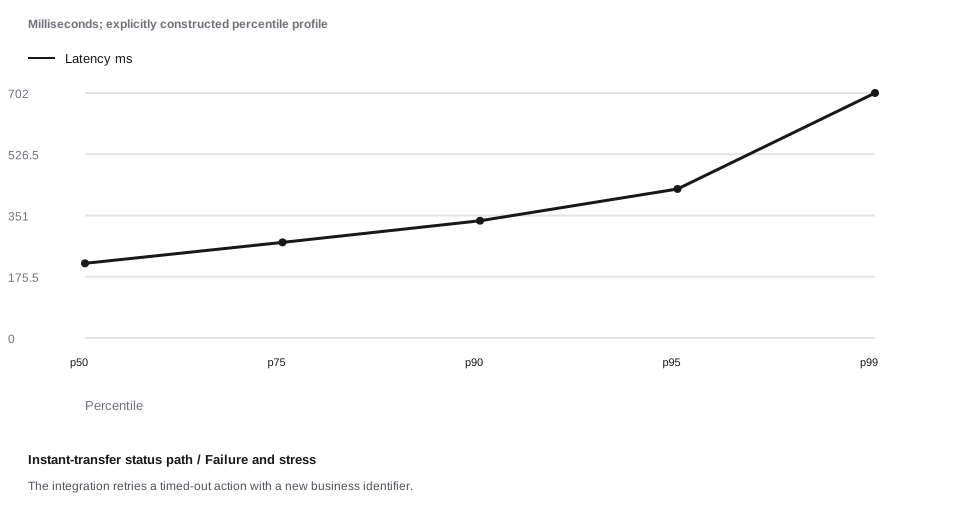
The constructed distribution separates the median from high percentiles. Percentiles are order statistics over the same request population; summing stage p99 values is not generally the service p99. This chart is a teaching profile, not a measured production distribution. Horizontal positions are the labeled observations or scenarios; equal spacing does not imply equal numerical increments.
Figure data and text version
| Percentile | Latency ms |
|---|---|
| p50 | 214 |
| p75 | 274 |
| p90 | 336 |
| p95 | 427 |
| p99 | 702 |
Retries increase attempted work
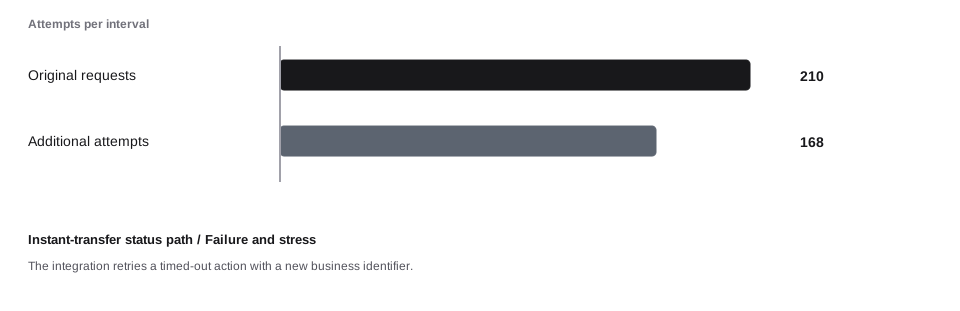
210 original requests produce 378 attempts under the stated average retry multiplier. The additional 168 attempts consume capacity even when their financial effect must remain idempotent. This simple model omits recursive retry storms across multiple layers.
Figure data and text version
| Attempt type | Count |
|---|---|
| Original requests | 210 |
| Additional attempts | 168 |
Attempted demand versus capacity
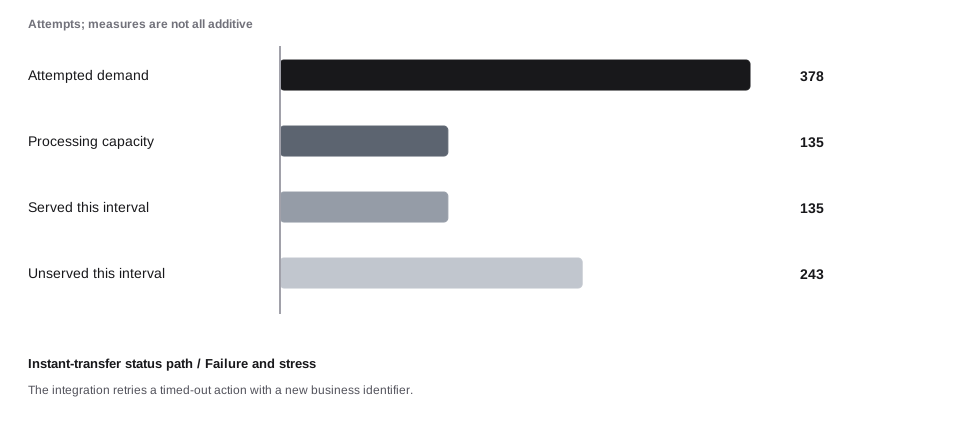
The interval has capacity for 135 attempts against 378 attempted requests. The difference is 243 unserved attempts in this simplified window. An unserved attempt is not necessarily an unexecuted business action: reconcile the stable action identifier before retrying a financial effect.
Figure data and text version
| Measure | Attempts |
|---|---|
| Attempted demand | 378 |
| Processing capacity | 135 |
| Served this interval | 135 |
| Unserved this interval | 243 |
Overload leaves a durable backlog
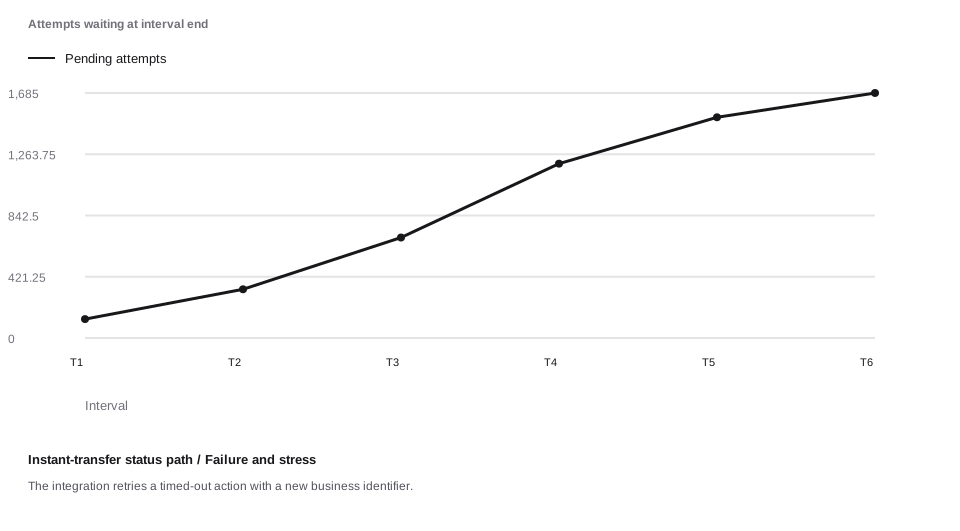
The six intervals use explicitly varied arrival multipliers and constant capacity. The queue carries forward unfinished attempts. Real systems also need a maximum age, admission policy, and expiry semantics so delayed work does not execute after its business authority has ended. Horizontal positions are the labeled observations or scenarios; equal spacing does not imply equal numerical increments.
Figure data and text version
| Interval | Pending attempts |
|---|---|
| T1 | 130 |
| T2 | 335 |
| T3 | 691 |
| T4 | 1,199 |
| T5 | 1,518 |
| T6 | 1,685 |
Throughput can stay flat while demand rises
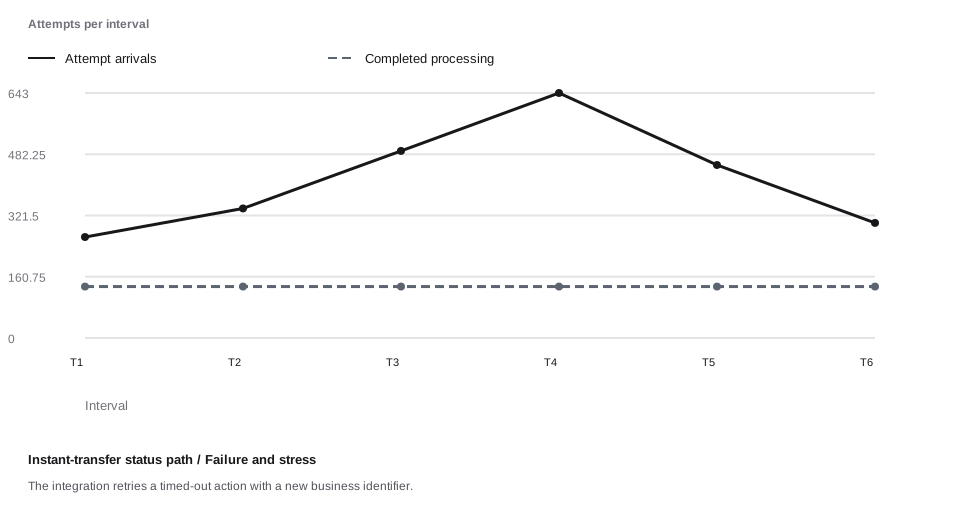
The completion count is limited by available work and capacity. A saturated completion line with a growing queue is evidence of overload, not stable end-to-end service. Inspect waiting time and customer outcomes alongside throughput. Horizontal positions are the labeled observations or scenarios; equal spacing does not imply equal numerical increments.
Figure data and text version
| Interval | Attempts | Completions |
|---|---|---|
| T1 | 265 | 135 |
| T2 | 340 | 135 |
| T3 | 491 | 135 |
| T4 | 643 | 135 |
| T5 | 454 | 135 |
| T6 | 302 | 135 |
Write state and pending effect together
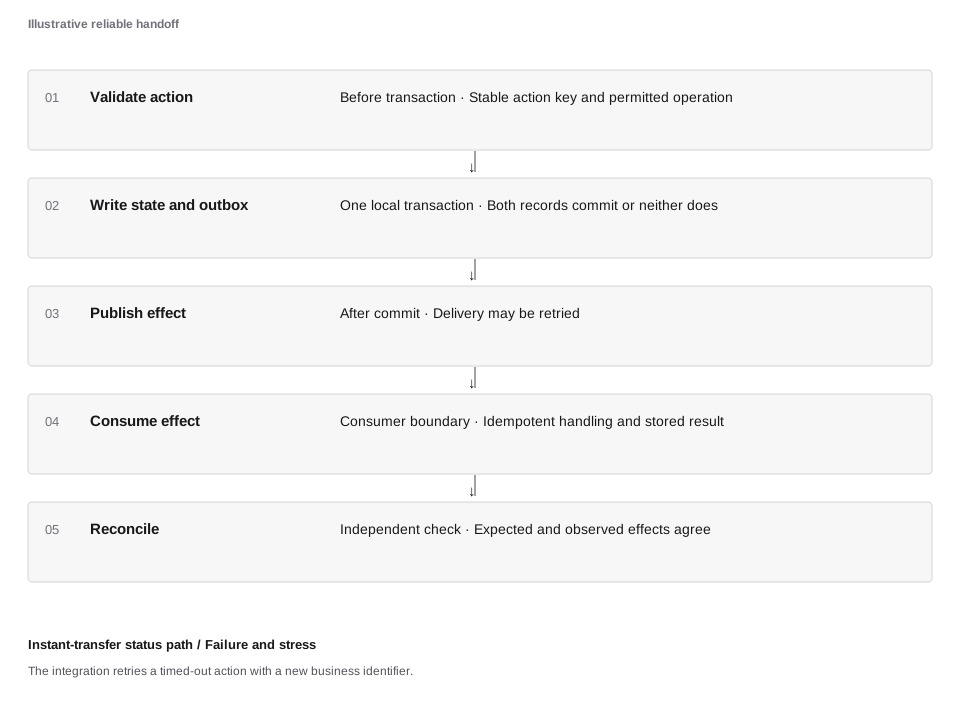
This sequence describes a transactional outbox within one datastore boundary. The publisher can deliver more than once, so the consumer also needs duplicate handling. A durable local handoff does not create a universal exactly-once guarantee across an external payment system.
Figure data and text version
| Event | Commit boundary | Evidence |
|---|---|---|
| Validate action | Before transaction | Stable action key and permitted operation |
| Write state and outbox | One local transaction | Both records commit or neither does |
| Publish effect | After commit | Delivery may be retried |
| Consume effect | Consumer boundary | Idempotent handling and stored result |
| Reconcile | Independent check | Expected and observed effects agree |
Repeated delivery and financial effects differ
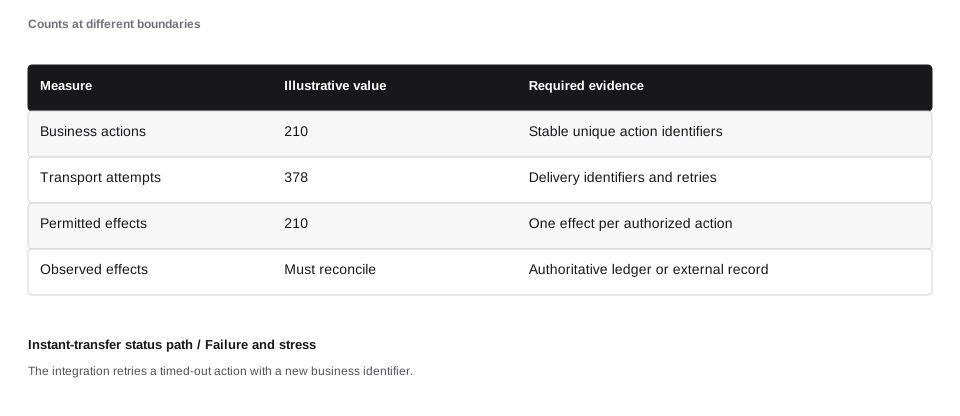
The example contains 378 transport attempts for 210 intended business actions. The protected effect count cannot be inferred from transport success alone. The table states the intended contract and the evidence needed to check it.
Figure data and text version
| Measure | Illustrative value | Required evidence |
|---|---|---|
| Business actions | 210 | Stable unique action identifiers |
| Transport attempts | 378 | Delivery identifiers and retries |
| Permitted effects | 210 | One effect per authorized action |
| Observed effects | Must reconcile | Authoritative ledger or external record |
An SLO budget is a measured allowance
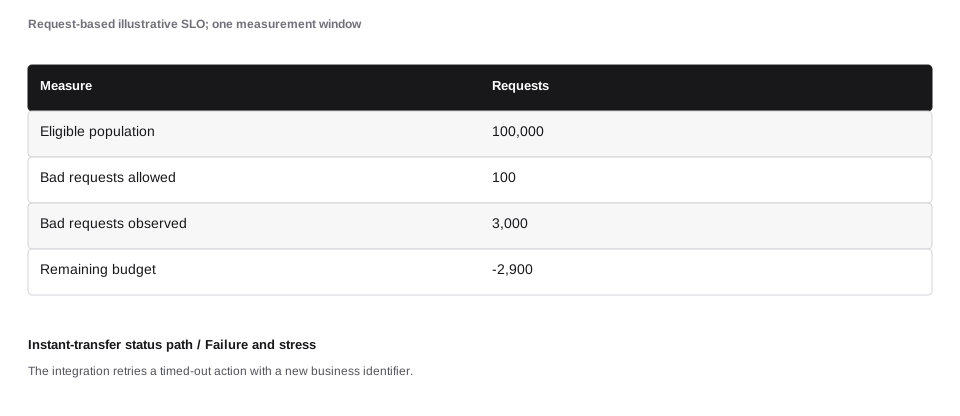
For 100,000 eligible requests and a 99.9% illustrative SLO, the budget is 100 bad requests. This case observes 3000. Eligibility, success, and measurement windows must be fixed before interpreting the result. An SLO allowance never overrides a legal or financial correctness requirement.
Figure data and text version
| Measure | Requests |
|---|---|
| Eligible population | 100,000 |
| Bad requests allowed | 100 |
| Bad requests observed | 3,000 |
| Remaining budget | -2,900 |
Dependency failures require scoped behavior
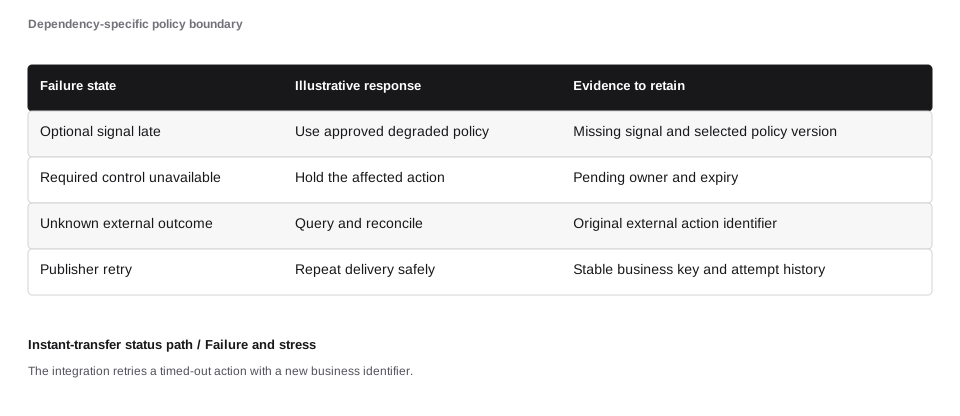
The dependency is receiving institution. The response depends on the operation, required control, and evidence available. The table gives illustrative behavior classes, not a universal fail-open rule.
Figure data and text version
| Failure state | Illustrative response | Evidence to retain |
|---|---|---|
| Optional signal late | Use approved degraded policy | Missing signal and selected policy version |
| Required control unavailable | Hold the affected action | Pending owner and expiry |
| Unknown external outcome | Query and reconcile | Original external action identifier |
| Publisher retry | Repeat delivery safely | Stable business key and attempt history |
Recovery ends with a reconciled population
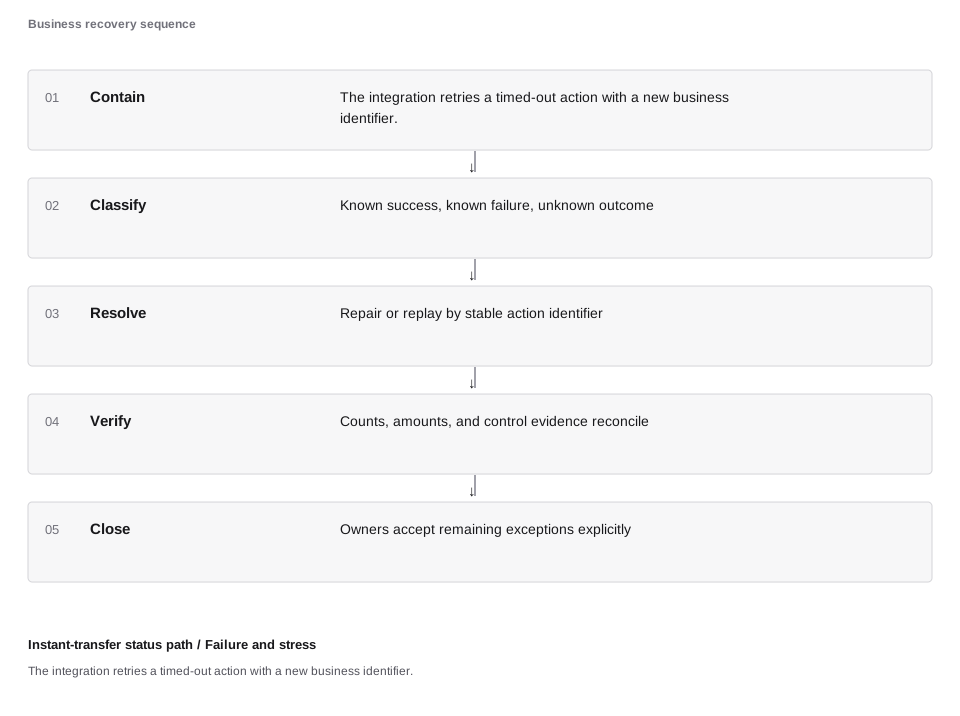
The last successful health probe does not close the incident. Recovery must classify affected actions, resolve unknown outcomes, restore required controls, and verify money and records. A replay is allowed only under the action’s current authority and idempotency contract.
Figure data and text version
| Stage | Completion evidence |
|---|---|
| Contain | The integration retries a timed-out action with a new business identifier. |
| Classify | Known success, known failure, unknown outcome |
| Resolve | Repair or replay by stable action identifier |
| Verify | Counts, amounts, and control evidence reconcile |
| Close | Owners accept remaining exceptions explicitly |
Connect the result to the system
Keep the original action identity, query its status, and reconcile before creating another effect.
Check the population, evidence, permitted action, and actual effect together. A balanced calculation can still use the wrong population; a successful response can still leave an unknown financial outcome. The case’s numerical result applies only to its stated assumptions.
Sources and further reading
The chapter sources support the concepts and scope. They do not prescribe the synthetic model rates.