
Queue service capacity
Size capacity with queue arithmetic
The population that monitoring actually sees
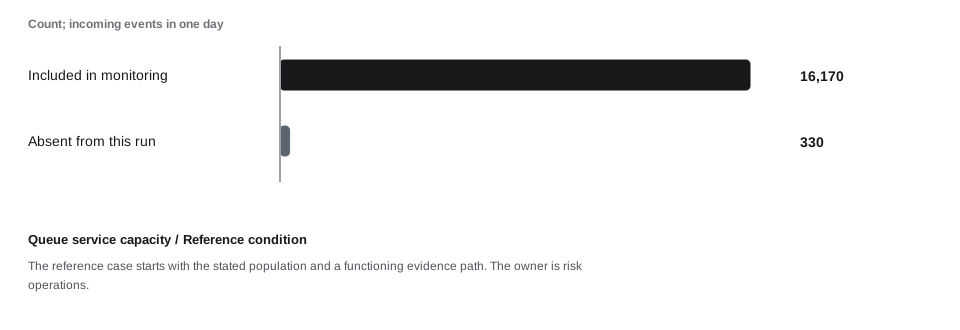
16,170 of 16,500 source items enter this monitoring calculation. The missing 330 items are a coverage gap, not evidence of low risk. Reconcile stable identifiers and amounts where appropriate before interpreting the alert rate.
Figure data and text version
| Population state | Items |
|---|---|
| Included in monitoring | 16,170 |
| Absent from this run | 330 |
An arrival count, handling-time distribution, and staffing plan describe different parts of queue demand. Averages can hide a growing tail of complex cases.
The reference case starts with the stated population and a functioning evidence path. The owner is risk operations.
All amounts, rates, capacity limits, and outcomes in this case are synthetic. The three conditions are separate assumptions for comparison. A better result in the response condition is not measured proof that the proposed control causes that improvement. The figures expose the calculation and its limits; a real deployment needs its own evidence.
Read the result
The daily source population is 16,500 items, but 330 are outside the completed monitoring run. The included population creates 663 hits and 544 unique cases. With 138 cases already open and capacity for 610, the queue closes at 72. Coverage, duplicate work, and staffing are separate causes; reducing one number does not prove that the overall control improved.
Model inputs and calculated values
Inputs below are the case-specific values. Each figure states the condition-specific assumptions and units used in its calculation. Calculated values are rounded for display.
| Input | Value |
|---|---|
| population | 16,500 |
| alertRate | 0.041 |
| capacity | 610 |
| backlog | 138 |
| Calculated value | Result |
|---|---|
| population | 16,500 |
| covered | 16,170 |
| missing | 330 |
| raw | 663 |
| duplicates | 119 |
| cases | 544 |
| opening | 138 |
| resolved | 610 |
| closing | 72 |
| capacity | 610 |
From scenario hits to unique cases
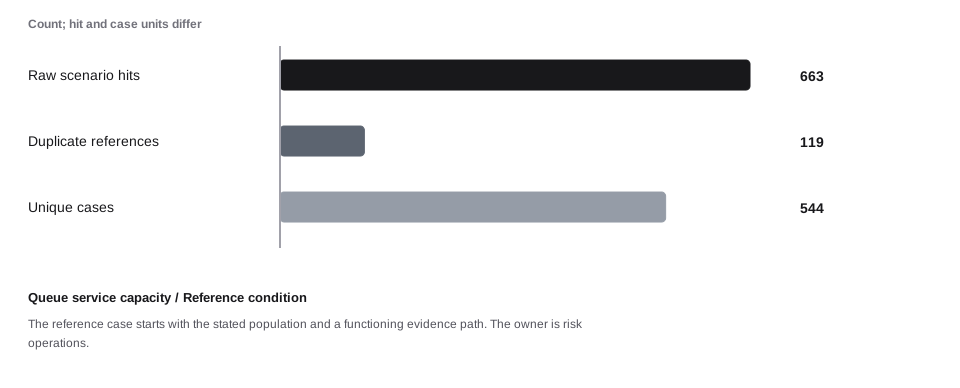
663 raw hits become 544 cases after removing 119 repeated references to the same case under the stated merge rule. Deduplication should reduce duplicate work while retaining the underlying events and reasons. It must not merge unrelated activity merely because values look similar.
Figure data and text version
| Stage | Count |
|---|---|
| Raw scenario hits | 663 |
| Duplicate references | 119 |
| Unique cases | 544 |
The queue balance is an accounting identity
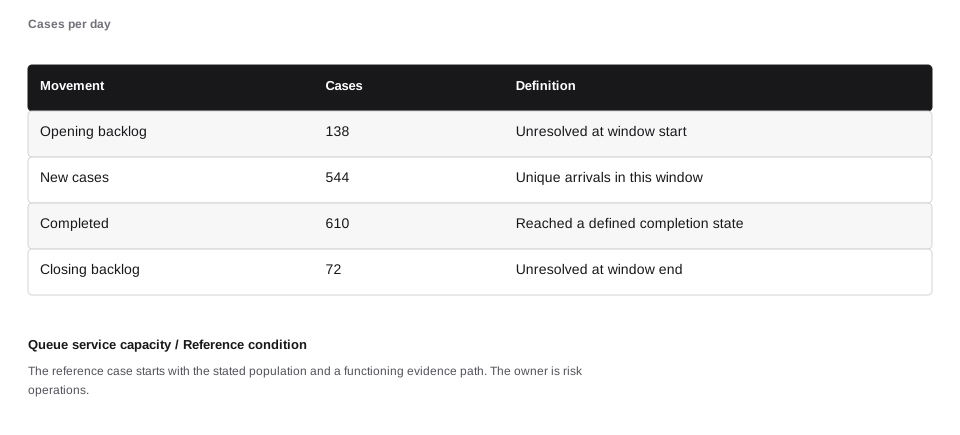
Opening backlog 138 + arrivals 544 − completed cases 610 = closing backlog 72. Completion is capped by both available work and the stated capacity. This identity is useful even when average handling times are uncertain.
Figure data and text version
| Movement | Cases | Definition |
|---|---|---|
| Opening backlog | 138 | Unresolved at window start |
| New cases | 544 | Unique arrivals in this window |
| Completed | 610 | Reached a defined completion state |
| Closing backlog | 72 | Unresolved at window end |
Backlog accumulates across uneven days
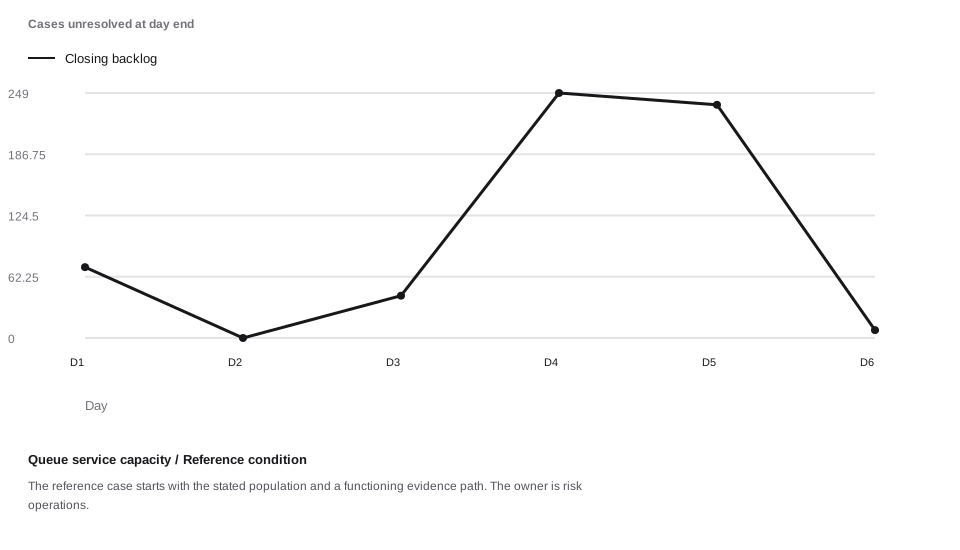
This deterministic six-day example applies a stated daily arrival multiplier and a constant completion capacity. Unused capacity does not carry forward as completed work. The series is a workload illustration; it omits variable case durations and specialist routing. Horizontal positions are the labeled observations or scenarios; equal spacing does not imply equal numerical increments.
Figure data and text version
| Day | Closing backlog |
|---|---|
| D1 | 72 |
| D2 | 0 |
| D3 | 43 |
| D4 | 249 |
| D5 | 237 |
| D6 | 8 |
Arrivals and completions need separate plots
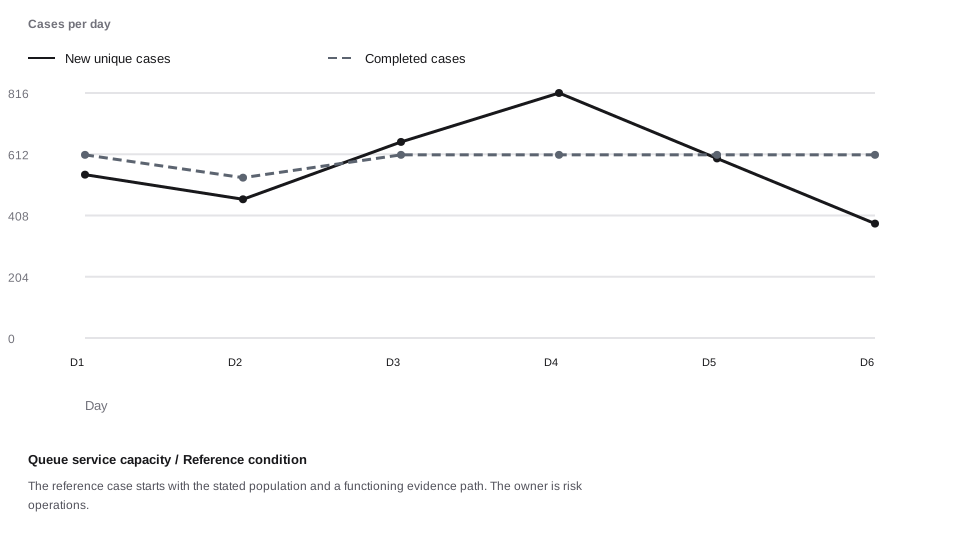
The service line cannot exceed the work available that day. A team can complete more cases than arrive while clearing an opening backlog. Conversely, stable staffing can coexist with a growing queue when arrivals remain higher than capacity. Horizontal positions are the labeled observations or scenarios; equal spacing does not imply equal numerical increments.
Figure data and text version
| Day | Arrivals | Completions |
|---|---|---|
| D1 | 544 | 610 |
| D2 | 462 | 534 |
| D3 | 653 | 610 |
| D4 | 816 | 610 |
| D5 | 598 | 610 |
| D6 | 381 | 610 |
An illustrative age profile of open work
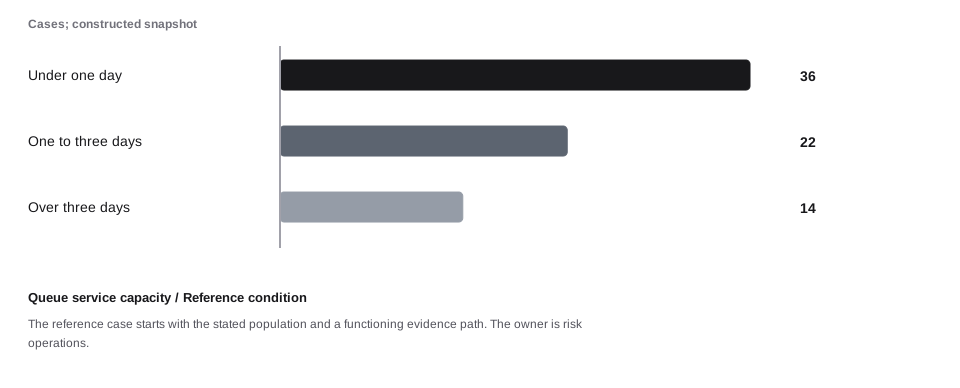
The closing backlog is 72 cases. The 50/30/remainder split is an explicit illustrative age allocation, not a distribution inferred from the arrival model. Production age buckets must come from each case’s actual receipt and status history.
Figure data and text version
| Age bucket | Open cases |
|---|---|
| Under one day | 36 |
| One to three days | 22 |
| Over three days | 14 |
Completion outcomes are not criminal labels
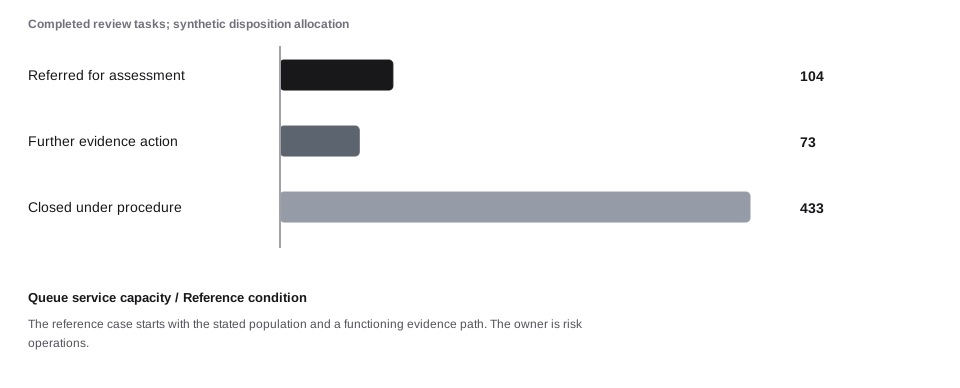
Of 610 completed review tasks, 104 are referred for further assessment, 73 need another evidence action, and 433 close under the stated procedure. These are operational outcomes. None is a probability of money laundering or a substitute for a reporting decision.
Figure data and text version
| Review disposition | Tasks |
|---|---|
| Referred for assessment | 104 |
| Further evidence action | 73 |
| Closed under procedure | 433 |
Known-event tests assess specific coverage
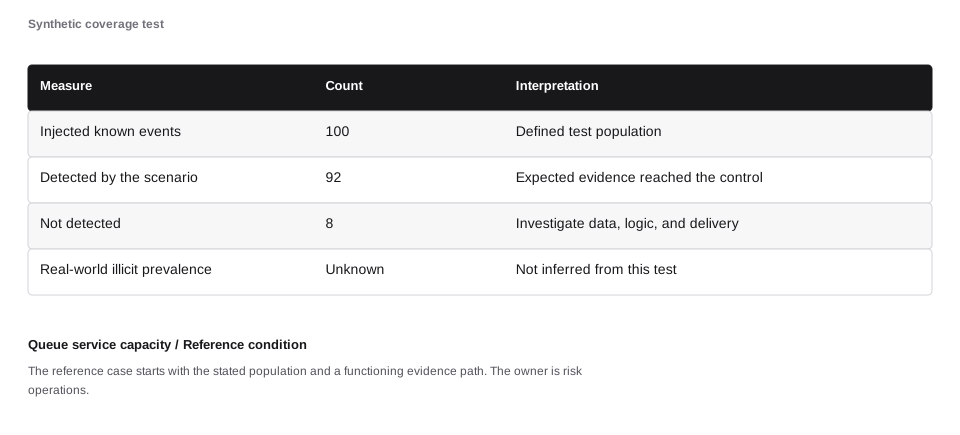
The injected test set contains 100 known test events designed to exercise size capacity with queue arithmetic. The system surfaces 92. That 92% detection result measures this constructed test set only; it does not establish population-wide detection of illicit activity.
Figure data and text version
| Measure | Count | Interpretation |
|---|---|---|
| Injected known events | 100 | Defined test population |
| Detected by the scenario | 92 | Expected evidence reached the control |
| Not detected | 8 | Investigate data, logic, and delivery |
| Real-world illicit prevalence | Unknown | Not inferred from this test |
Data quality has several independent dimensions
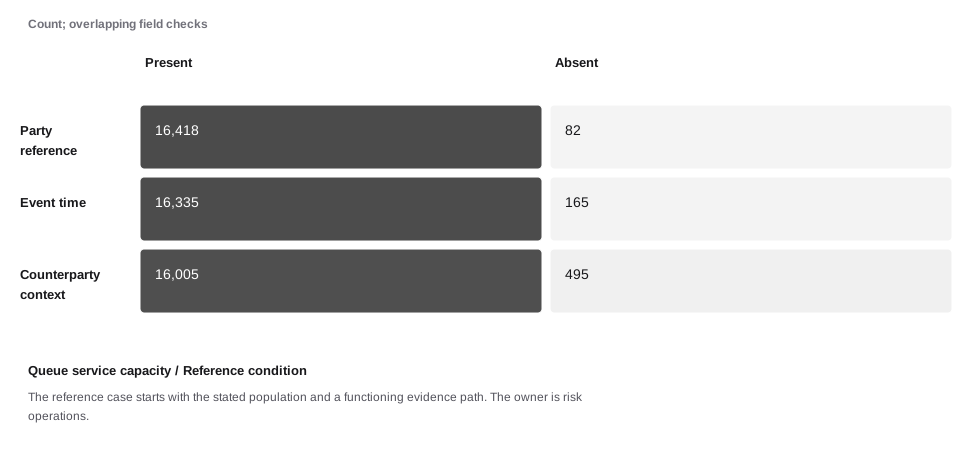
Each row is a different field requirement over the same source population. Completeness alone does not establish that values are accurate or current. The case uses explicit illustrative missing counts to show how data quality can affect scenario coverage.
Figure data and text version
| Field requirement | Present | Absent |
|---|---|---|
| Party reference | 16,418 | 82 |
| Event time | 16,335 | 165 |
| Counterparty context | 16,005 | 495 |
Type the relationship before drawing an inference
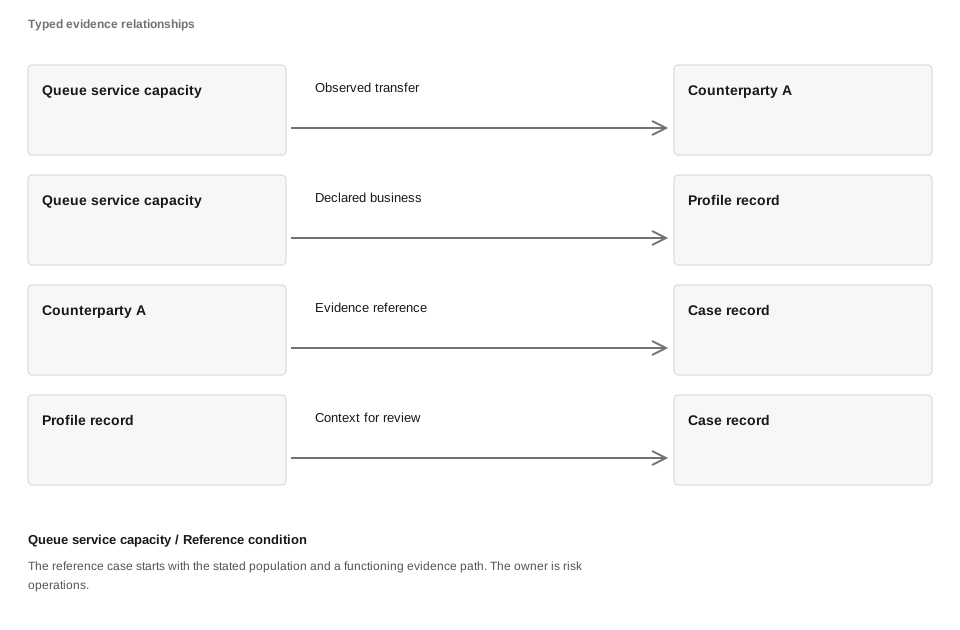
This evidence map distinguishes a customer relationship, a transfer, and a case reference. The links support size capacity with queue arithmetic; they do not imply common ownership or intent. A shared data point is a lead whose meaning depends on source, time, and context.
Figure data and text version
| From | To | Relationship |
|---|---|---|
| Queue service capacity | Counterparty A | Observed transfer |
| Queue service capacity | Profile record | Declared business |
| Counterparty A | Case record | Evidence reference |
| Profile record | Case record | Context for review |
Case clocks start from defined events
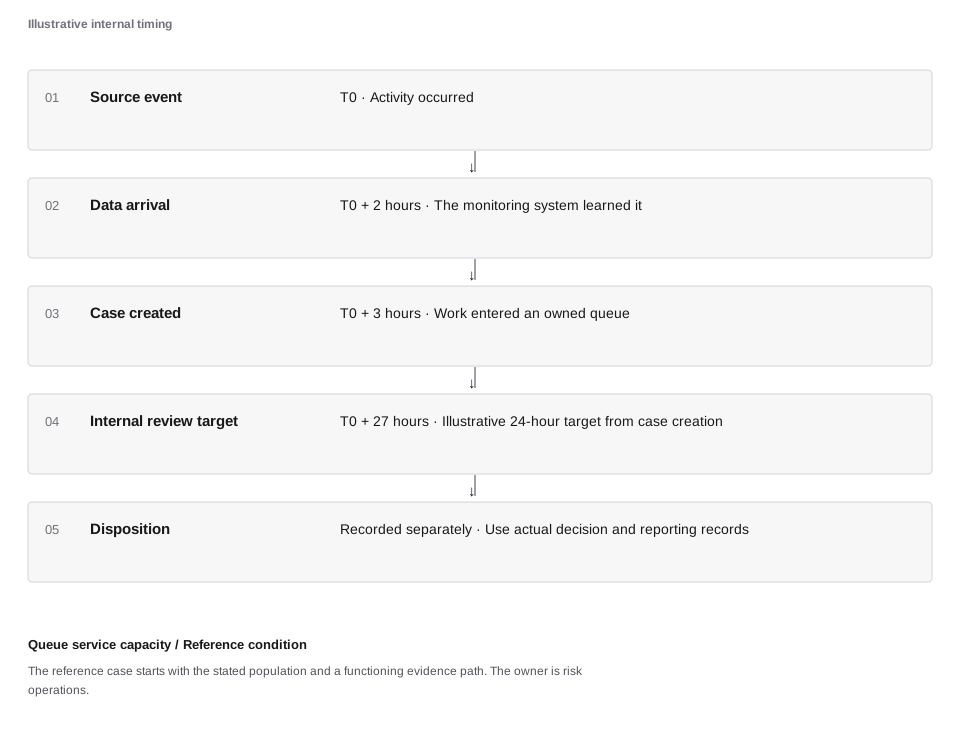
A legal deadline, an internal response target, and an evidence-expiry date can start from different events. The hours here are internal teaching targets only. They are not BSA, sanctions, consumer-protection, or other statutory deadlines.
Figure data and text version
| Event | Relative time | Operational meaning |
|---|---|---|
| Source event | T0 | Activity occurred |
| Data arrival | T0 + 2 hours | The monitoring system learned it |
| Case created | T0 + 3 hours | Work entered an owned queue |
| Internal review target | T0 + 27 hours | Illustrative 24-hour target from case creation |
| Disposition | Recorded separately | Use actual decision and reporting records |
The end-to-end delivery contract
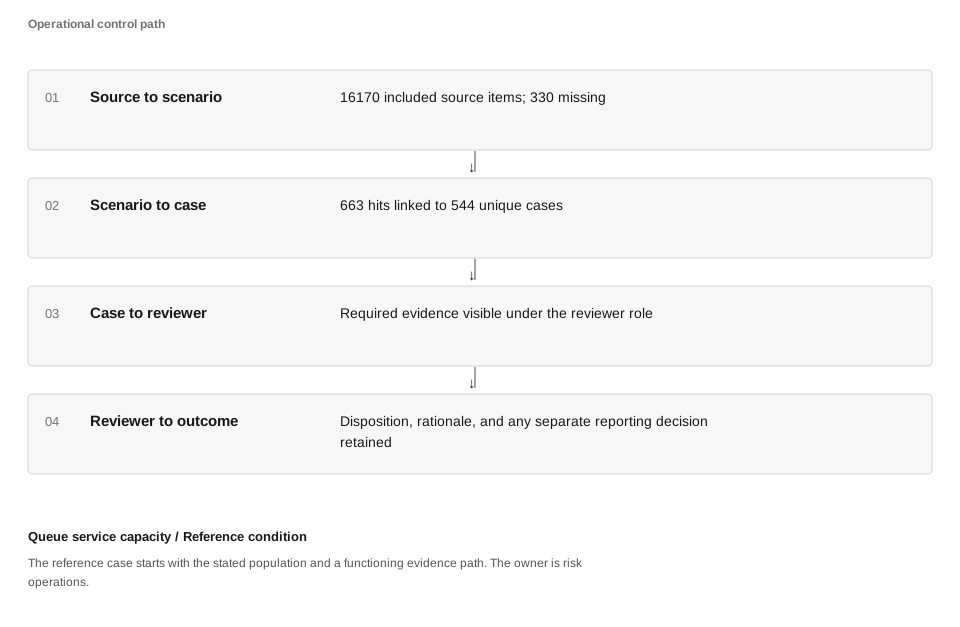
The scenario is incomplete until the intended evidence reaches an owned case. For size capacity with queue arithmetic, verify source coverage, hit creation, queue acceptance, reviewer access, and final disposition separately. A green job status proves only that a job reported completion.
Figure data and text version
| Boundary | Acceptance evidence |
|---|---|
| Source to scenario | 16170 included source items; 330 missing |
| Scenario to case | 663 hits linked to 544 unique cases |
| Case to reviewer | Required evidence visible under the reviewer role |
| Reviewer to outcome | Disposition, rationale, and any separate reporting decision retained |
Connect the result to the system
Measure cases rather than duplicate hits and track workload, service, age, and carryover.
Check the population, evidence, permitted action, and actual effect together. A balanced calculation can still use the wrong population; a successful response can still leave an unknown financial outcome. The case’s numerical result applies only to its stated assumptions.
Sources and further reading
The chapter sources support the concepts and scope. They do not prescribe the synthetic model rates.