
Boundary-condition verification
Test the boundary conditions
Determine the eligible population first
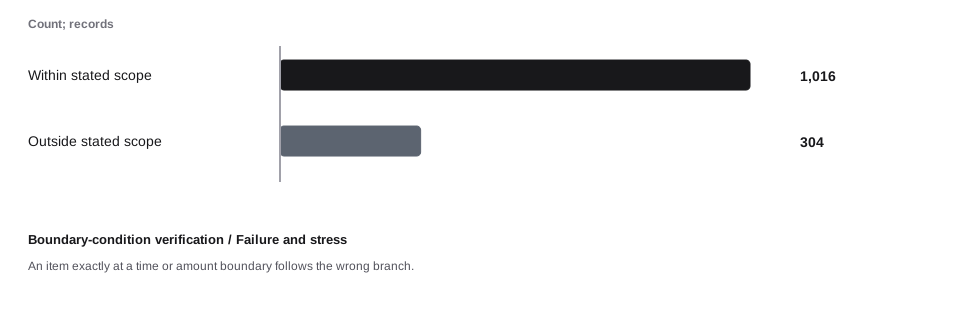
Of 1,320 source records, 1,016 are within the stated synthetic scope and 304 are outside it. Eligibility here is an explicit teaching input, not a legal conclusion. Production classification must use the actual entity, product, activity, jurisdiction, and facts.
Figure data and text version
| Scope state | Records |
|---|---|
| Within stated scope | 1,016 |
| Outside stated scope | 304 |
A control can work for ordinary cases and fail at a cutoff, product change, or missing-data condition. Those boundaries need deliberate evidence.
An item exactly at a time or amount boundary follows the wrong branch.
All amounts, rates, capacity limits, and outcomes in this case are synthetic. The three conditions are separate assumptions for comparison. A better result in the response condition is not measured proof that the proposed control causes that improvement. The figures expose the calculation and its limits; a real deployment needs its own evidence.
Read the result
The case identifies 1,016 eligible records from a source population of 1,320. The required workflow completes for 792, but 103 completed records miss the illustrative internal target. Another 224 remain incomplete. Communication evidence covers 689 generated notices. Scope, completion, timeliness, and delivery are four separate properties of the customer outcome.
Model inputs and calculated values
Inputs below are the case-specific values. Each figure states the condition-specific assumptions and units used in its calculation. Calculated values are rounded for display.
| Input | Value |
|---|---|
| population | 1,320 |
| eligibility | 0.77 |
| Calculated value | Result |
|---|---|
| population | 1,320 |
| eligible | 1,016 |
| excluded | 304 |
| complete | 792 |
| incomplete | 224 |
| late | 103 |
| ontime | 689 |
| notices | 689 |
| undelivered | 103 |
| pending | 104 |
| reviewed | 120 |
A control can miss eligible records
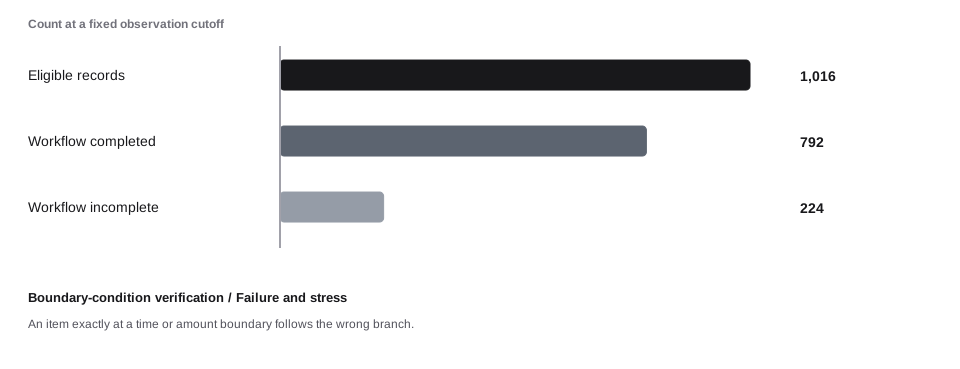
The required workflow completes for 792 of the 1,016 eligible records. The 224 remainder needs an owned exception path. Reporting completion as a percentage of all source records would answer a different question and could hide the actual coverage gap.
Figure data and text version
| Measure | Records |
|---|---|
| Eligible records | 1,016 |
| Workflow completed | 792 |
| Workflow incomplete | 224 |
Completion and timeliness are distinct outcomes
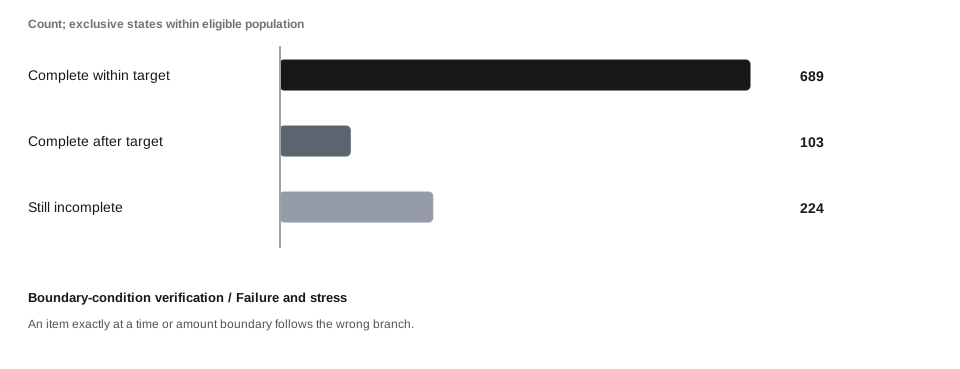
The illustration applies an internal target, not a statutory deadline. Of 792 completed records, 103 miss that target and 689 meet it. The 224 open records are a third state; do not automatically classify them as timely merely because their final outcome is unknown.
Figure data and text version
| Outcome | Eligible records |
|---|---|
| Complete within target | 689 |
| Complete after target | 103 |
| Still incomplete | 224 |
An obligation record connects authority to behavior
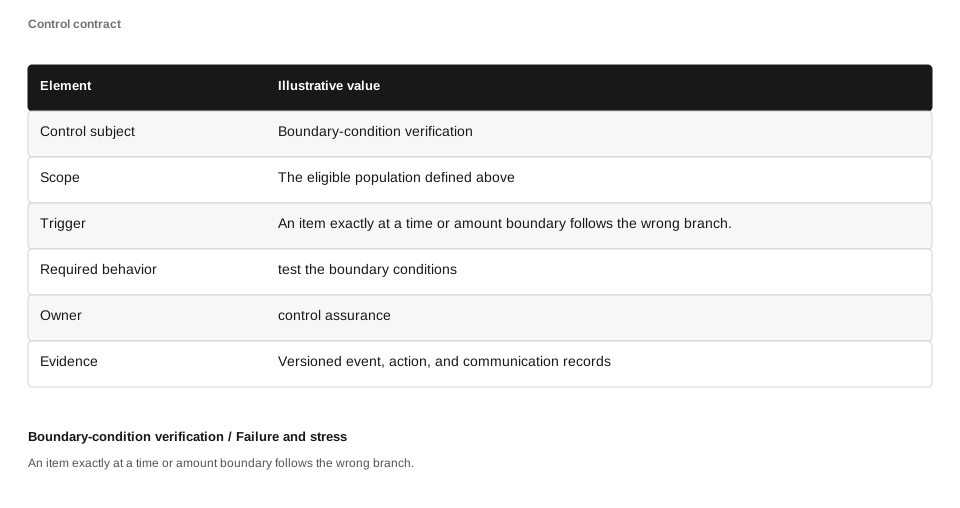
This case implements test the boundary conditions. The record separates scope, trigger, required action, ownership, and retained proof. Exact legal duties belong to the applicable source and interpretation; the timing and counts in this worked example are synthetic.
Figure data and text version
| Element | Illustrative value |
|---|---|
| Control subject | Boundary-condition verification |
| Scope | The eligible population defined above |
| Trigger | An item exactly at a time or amount boundary follows the wrong branch. |
| Required behavior | test the boundary conditions |
| Owner | control assurance |
| Evidence | Versioned event, action, and communication records |
Different clocks start from different facts
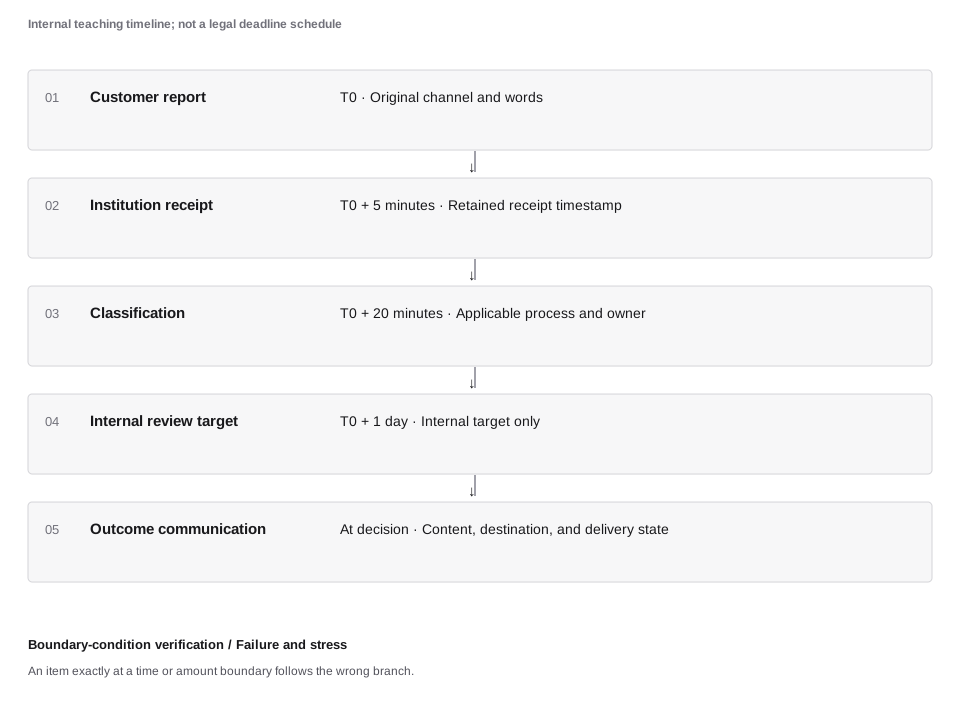
These relative times are illustrative service targets. They deliberately distinguish customer contact, receipt by the institution, classification, investigation, and communication. A routing delay must not silently replace the original receipt time when that fact matters.
Figure data and text version
| Event | Illustrative time | Record |
|---|---|---|
| Customer report | T0 | Original channel and words |
| Institution receipt | T0 + 5 minutes | Retained receipt timestamp |
| Classification | T0 + 20 minutes | Applicable process and owner |
| Internal review target | T0 + 1 day | Internal target only |
| Outcome communication | At decision | Content, destination, and delivery state |
Evidence fields fail independently
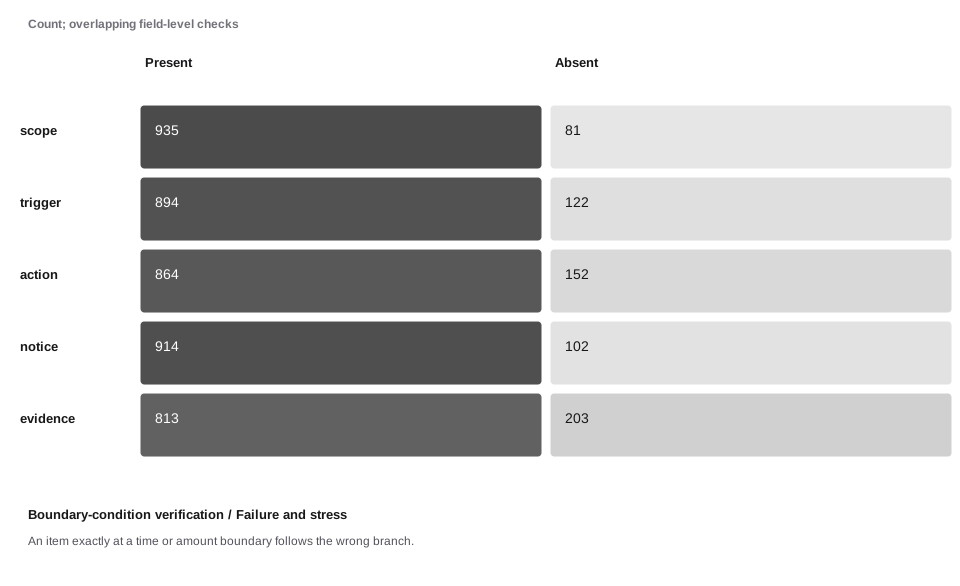
Each row is one evidence requirement over the eligible population. The same record can fail several checks, so the absent counts across rows must not be added as though they were distinct customers. Completeness does not itself prove that a field is accurate.
Figure data and text version
| Evidence field | Present | Absent |
|---|---|---|
| scope | 935 | 81 |
| trigger | 894 | 122 |
| action | 864 | 152 |
| notice | 914 | 102 |
| evidence | 813 | 203 |
A generated notice is not a delivered notice
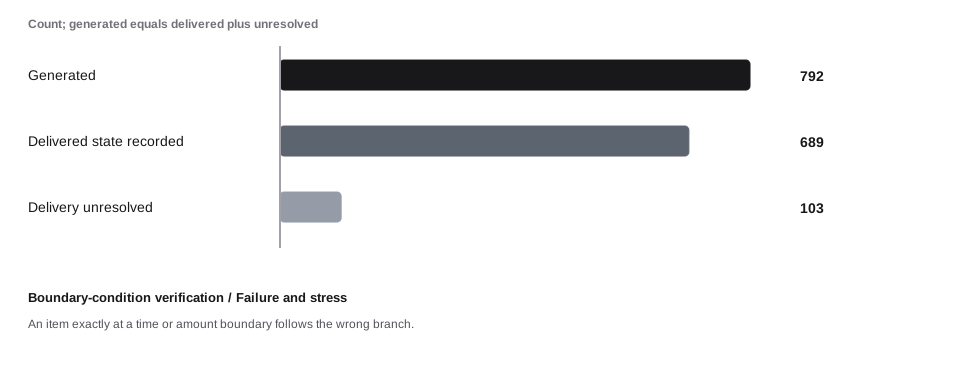
792 completed records generate a modeled notice event. 689 have a delivered state and 103 do not. The system must distinguish generation, dispatch, delivery evidence, and any required follow-up under the actual process.
Figure data and text version
| Communication state | Notices |
|---|---|
| Generated | 792 |
| Delivered state recorded | 689 |
| Delivery unresolved | 103 |
Authority differs by operation
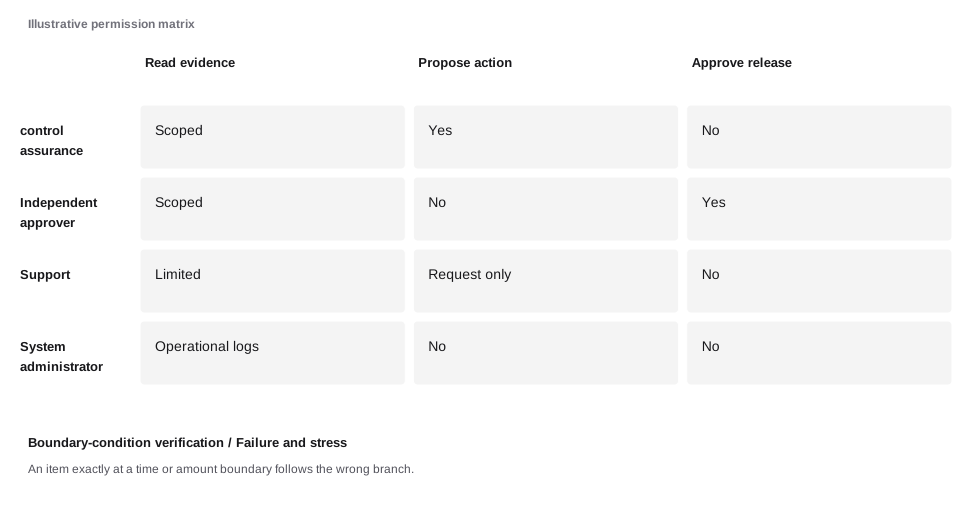
The access matrix is a proposed teaching separation of duties. Read, propose, approve, and administer are distinct capabilities. The final policy must match the organization’s actual roles and obligations, with controlled emergency access and an audit trail.
Figure data and text version
| Role | Read evidence | Propose action | Approve release |
|---|---|---|---|
| control assurance | Scoped | Yes | No |
| Independent approver | Scoped | No | Yes |
| Support | Limited | Request only | No |
| System administrator | Operational logs | No | No |
Exceptions need capacity and a closing state
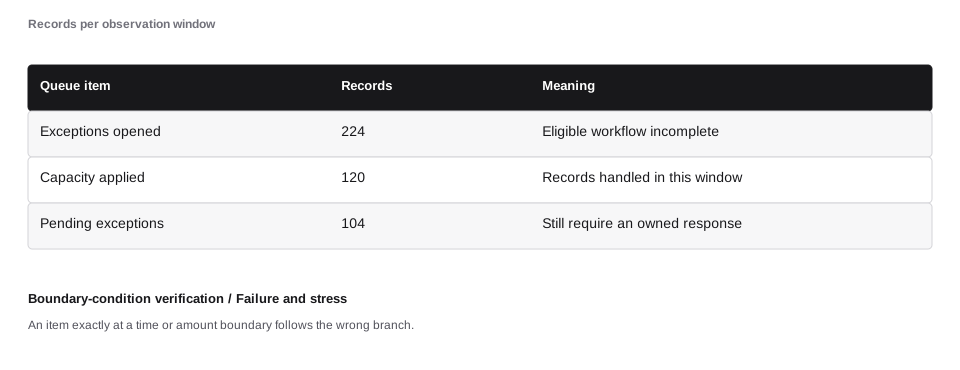
The control has 224 incomplete records. The available exception capacity covers 120, leaving 104 pending. A pending state requires an owner and a next action; changing a status label without resolving the required behavior does not close the gap.
Figure data and text version
| Queue item | Records | Meaning |
|---|---|---|
| Exceptions opened | 224 | Eligible workflow incomplete |
| Capacity applied | 120 | Records handled in this window |
| Pending exceptions | 104 | Still require an owned response |
A rate includes its denominator
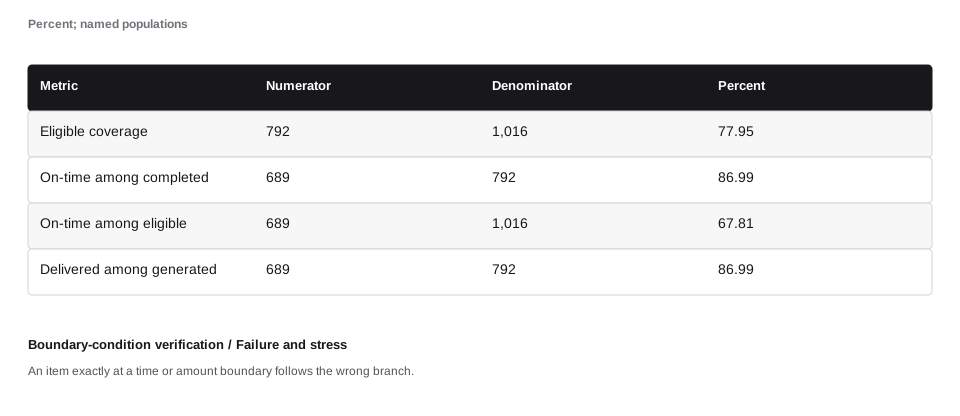
These rates deliberately use different populations. Overall throughput, eligible coverage, completed-record timeliness, and delivery evidence are not interchangeable. Each needs the same cohort, cutoff, and definition every time it is compared.
Figure data and text version
| Metric | Numerator | Denominator | Percent |
|---|---|---|---|
| Eligible coverage | 792 | 1,016 | 77.95 |
| On-time among completed | 689 | 792 | 86.99 |
| On-time among eligible | 689 | 1,016 | 67.81 |
| Delivered among generated | 689 | 792 | 86.99 |
A change needs an evidence trail
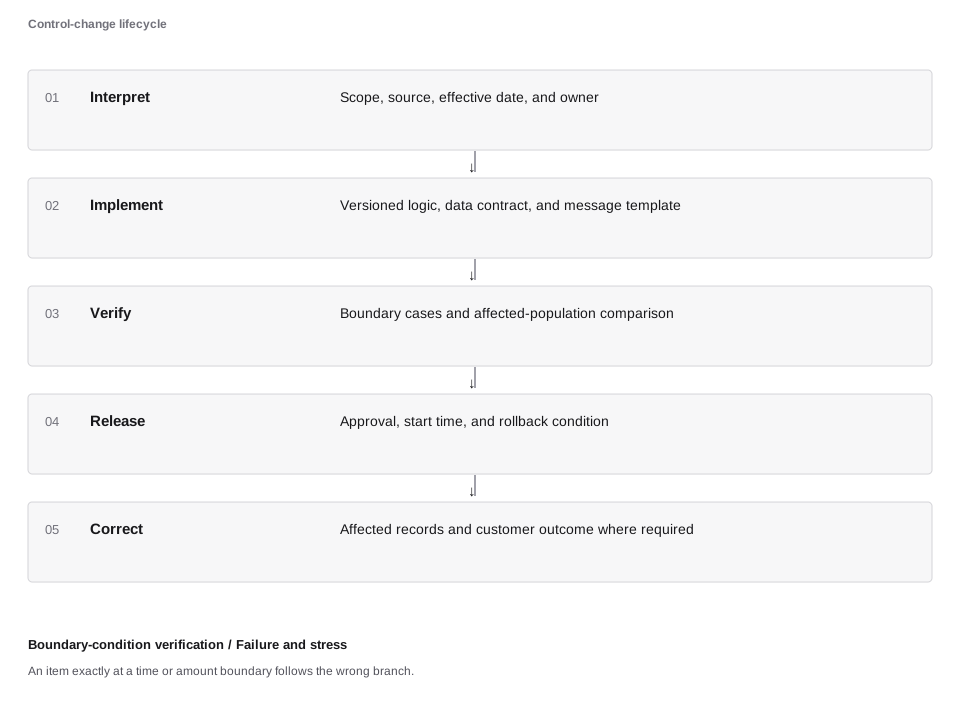
The trigger is An item exactly at a time or amount boundary follows the wrong branch.. A controlled change connects the revised requirement or interpretation to implementation, replay, customer impact, and approval. The old version remains relevant to decisions already made under it.
Figure data and text version
| Stage | Retained proof |
|---|---|
| Interpret | Scope, source, effective date, and owner |
| Implement | Versioned logic, data contract, and message template |
| Verify | Boundary cases and affected-population comparison |
| Release | Approval, start time, and rollback condition |
| Correct | Affected records and customer outcome where required |
Correction follows the affected population
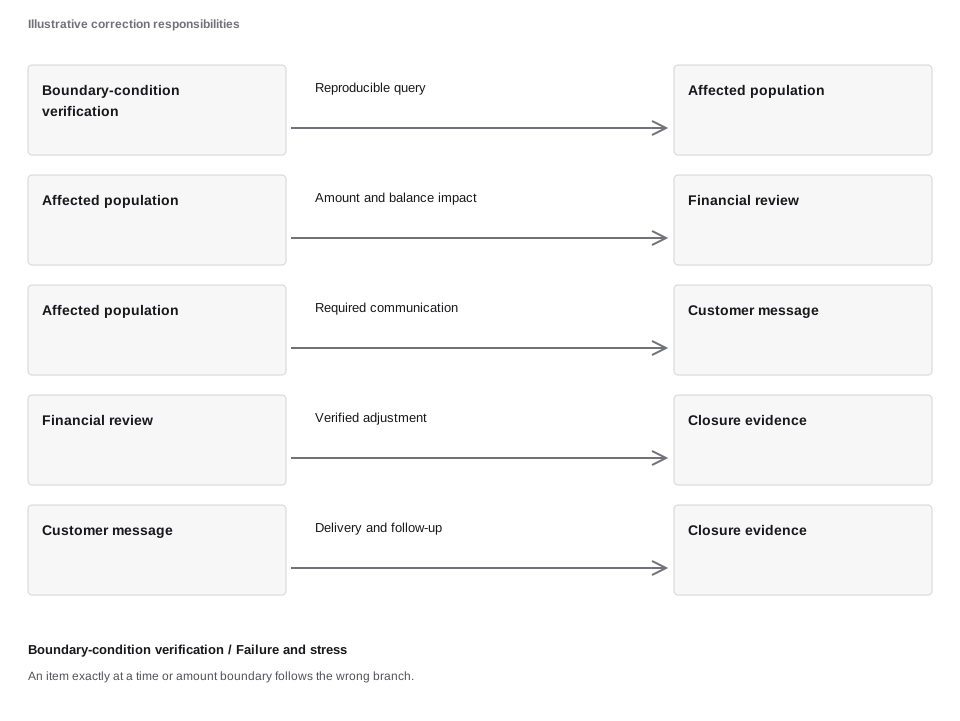
A remediation map links the defect to affected records, financial consequences, communication, and closure evidence. It should retain exclusions and unresolved cases. A change that prevents future failures does not by itself correct earlier customer outcomes.
Figure data and text version
| From | To | Relationship |
|---|---|---|
| Boundary-condition verification | Affected population | Reproducible query |
| Affected population | Financial review | Amount and balance impact |
| Affected population | Customer message | Required communication |
| Financial review | Closure evidence | Verified adjustment |
| Customer message | Closure evidence | Delivery and follow-up |
Connect the result to the system
Specify inclusivity, time basis, null handling, and the relevant source before implementation.
Check the population, evidence, permitted action, and actual effect together. A balanced calculation can still use the wrong population; a successful response can still leave an unknown financial outcome. The case’s numerical result applies only to its stated assumptions.
Sources and further reading
The chapter sources support the concepts and scope. They do not prescribe the synthetic model rates.